Open Access
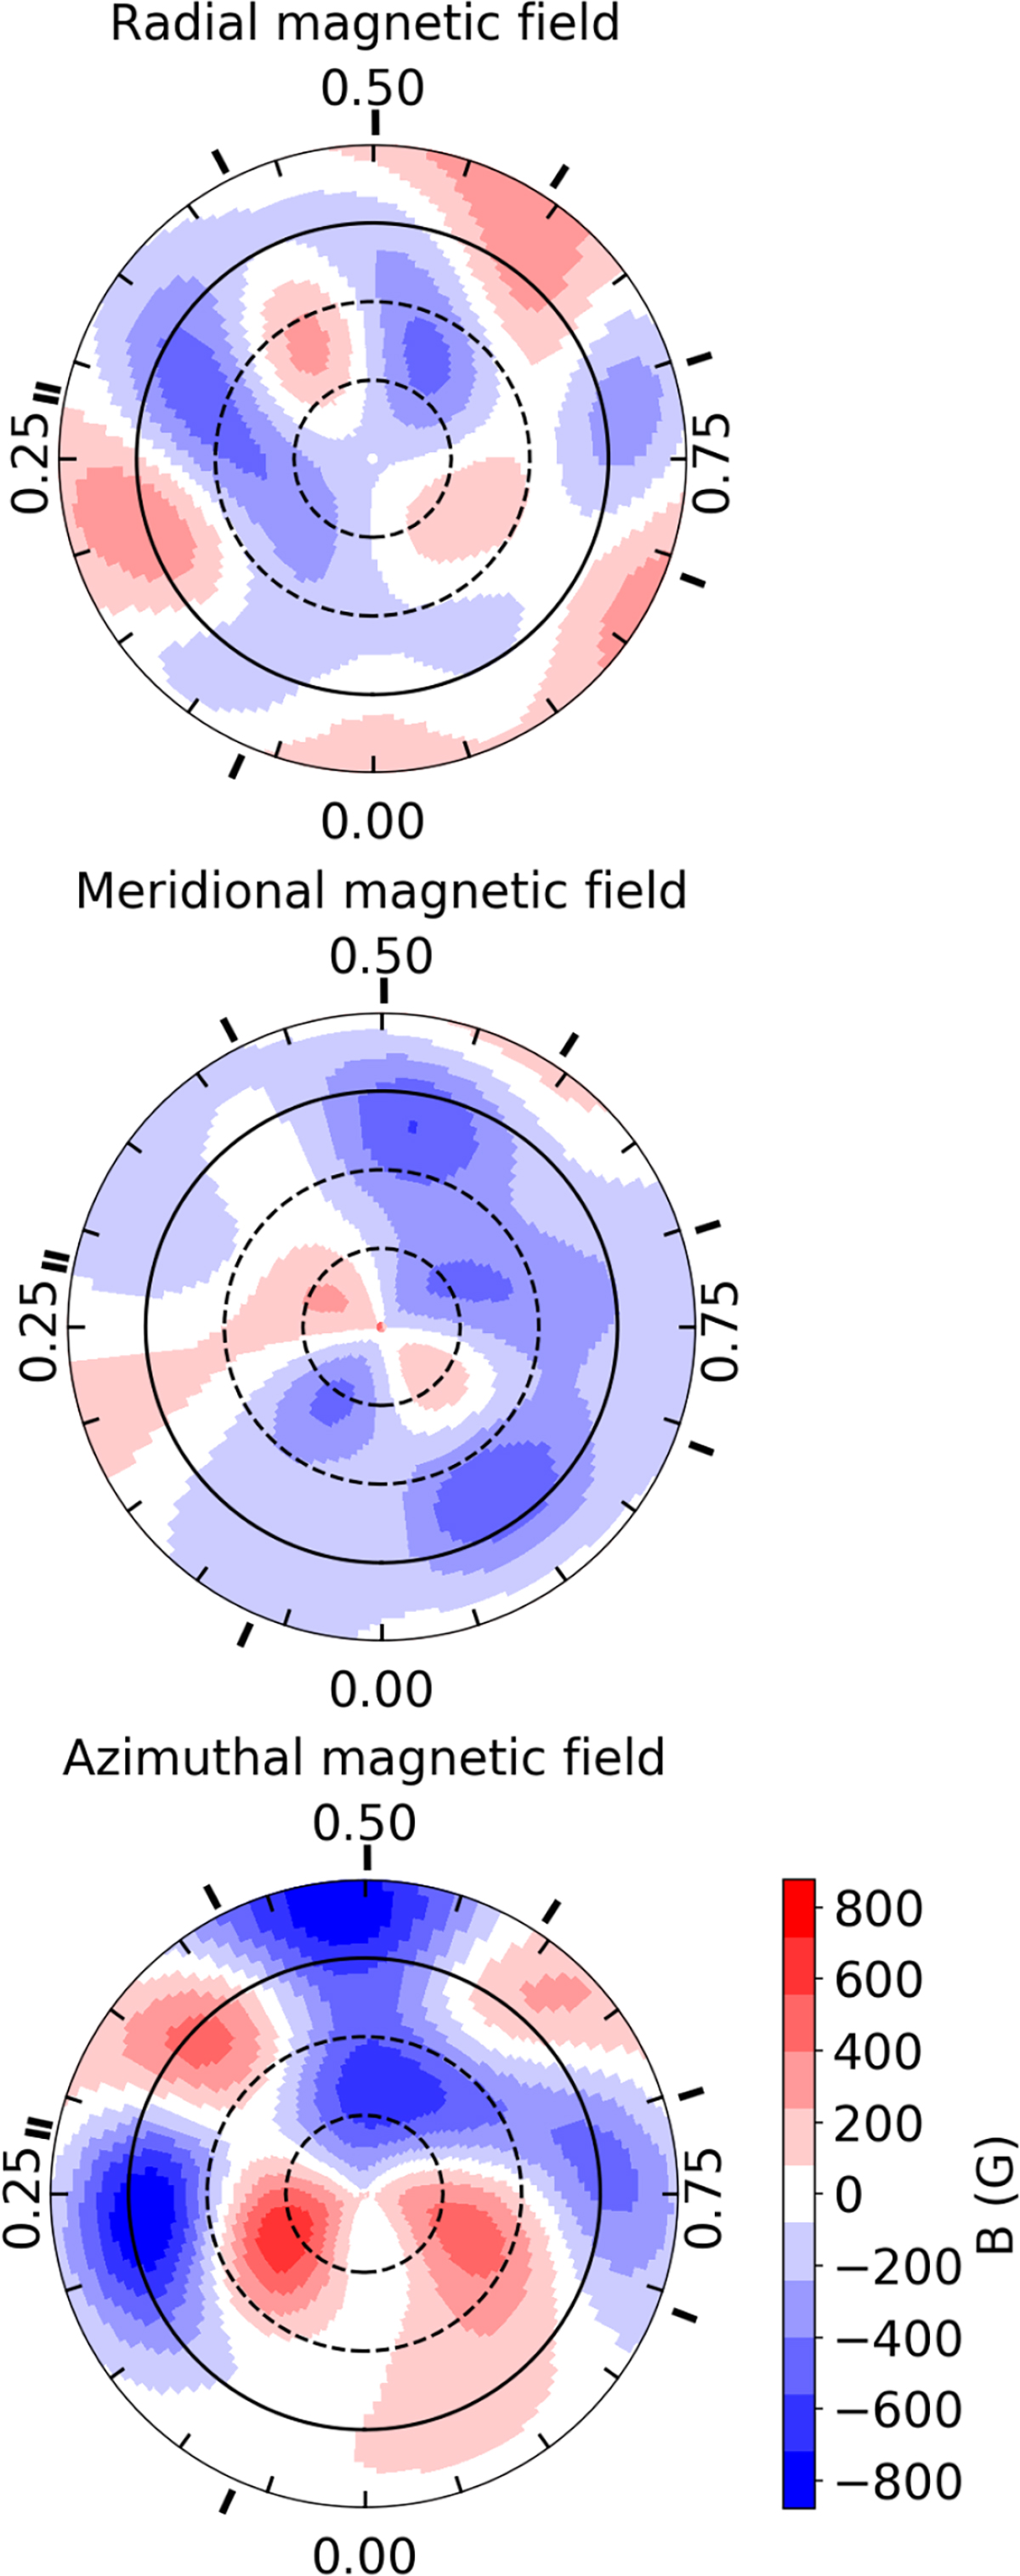
Fig. 12.
Download original image
ZDI maps of the radial (top), meridional (middle), and azimuthal (bottom) components of the large-scale magnetic field at the surface of JH 223. Similar to Fig. 11, the star is represented in a flattened polar projection. Magnetic fluxes, indicated by the color bar, are expressed in gauss.
Current usage metrics show cumulative count of Article Views (full-text article views including HTML views, PDF and ePub downloads, according to the available data) and Abstracts Views on Vision4Press platform.
Data correspond to usage on the plateform after 2015. The current usage metrics is available 48-96 hours after online publication and is updated daily on week days.
Initial download of the metrics may take a while.