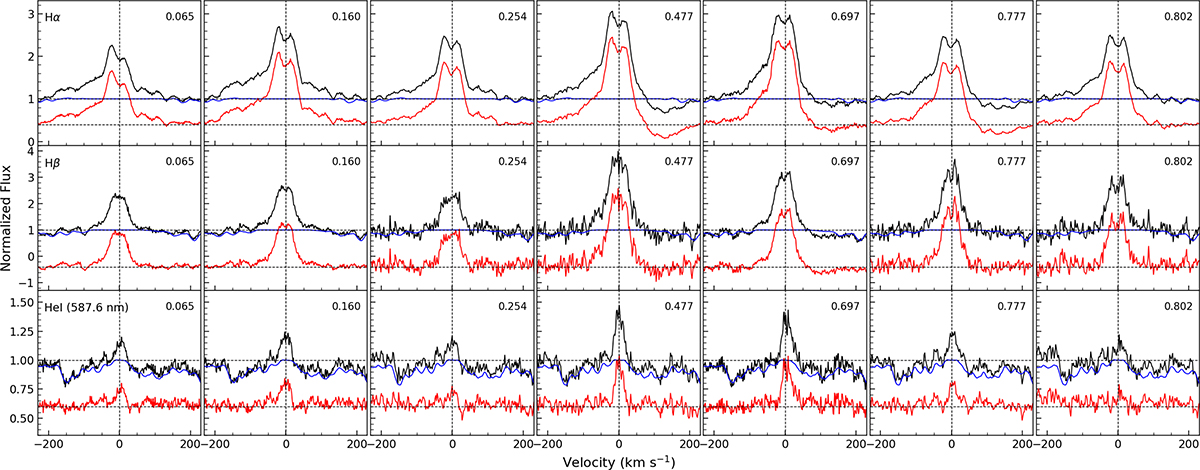
Fig. B.1.
Download original image
Circumstellar emission lines of Hα (top row), Hβ (middle row), and He I 587.6nm (bottom row) from the GRACES (Cols. 3, 4, 6, and 7) and Keck (Cols. 1, 2, and 5) observations. The blue curves show the spectrum of TWA 7, used as a photospheric template. The black and red curves correspond to the spectrum of JH 223 before and after removal of the photospheric contribution, respectively. The photosphere-subtracted spectra are vertically shifted for clarity.
Current usage metrics show cumulative count of Article Views (full-text article views including HTML views, PDF and ePub downloads, according to the available data) and Abstracts Views on Vision4Press platform.
Data correspond to usage on the plateform after 2015. The current usage metrics is available 48-96 hours after online publication and is updated daily on week days.
Initial download of the metrics may take a while.