Open Access
Fig. 2.
Download original image
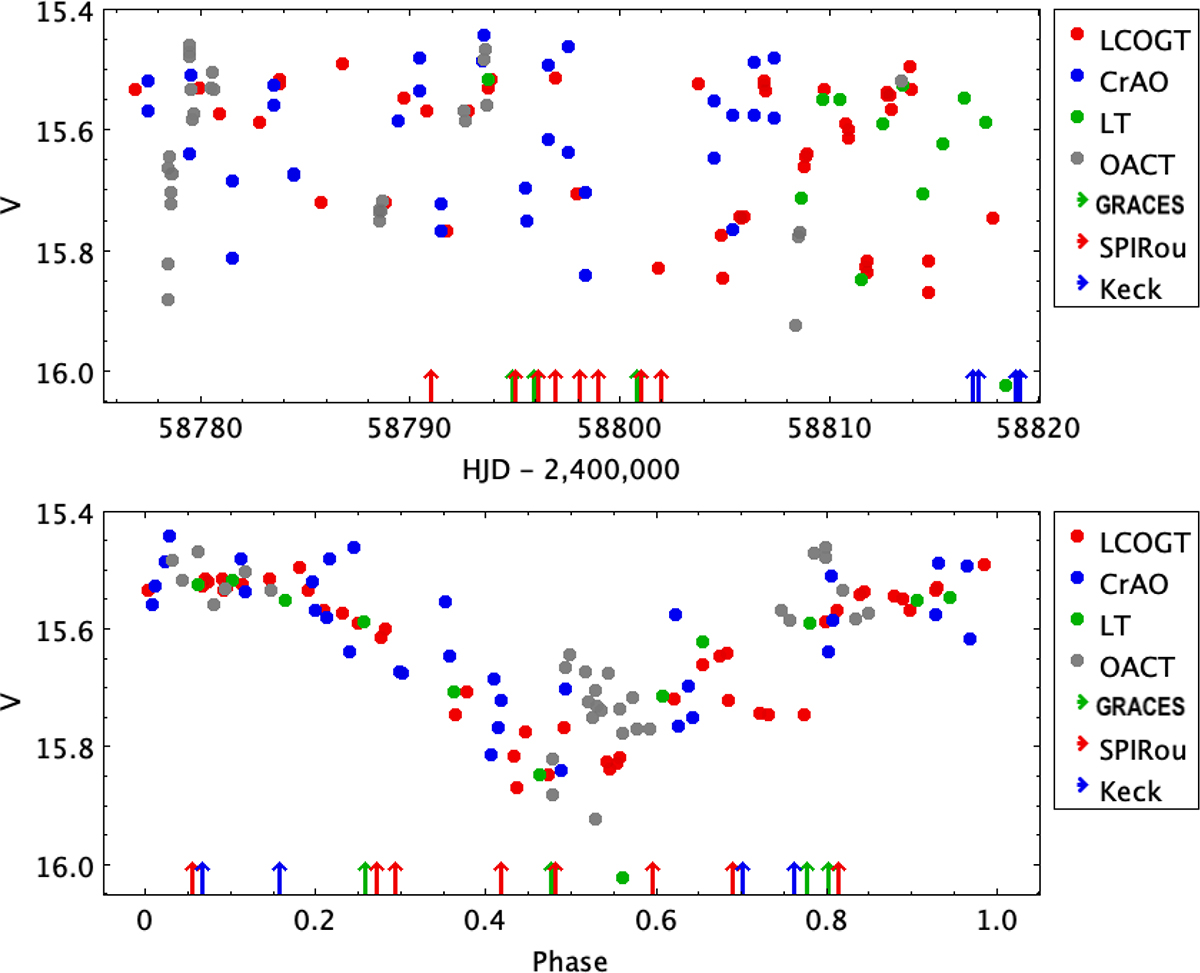
JH 223 V-band light curve versus HJD (top) and rotational phase (bottom). The phased light curve uses a period of 3.31days and JD0 = 2 458 770.2388 (phase 0.5 at minimum). Arrows mark the epochs of spectroscopic and spectropolarimetric observations. CrAO and OACT data show larger scatter due to higher uncertainties.
Current usage metrics show cumulative count of Article Views (full-text article views including HTML views, PDF and ePub downloads, according to the available data) and Abstracts Views on Vision4Press platform.
Data correspond to usage on the plateform after 2015. The current usage metrics is available 48-96 hours after online publication and is updated daily on week days.
Initial download of the metrics may take a while.