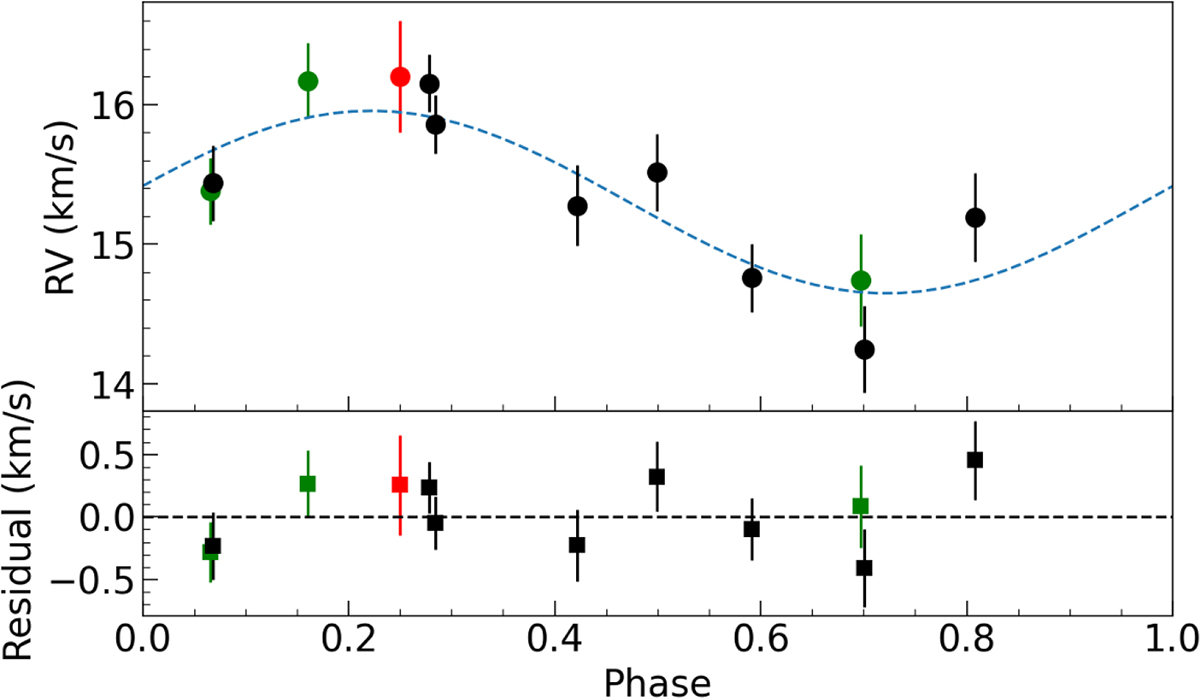
Fig. 9.
Download original image
JH 223 radial velocities (top) and residuals (bottom). Radial velocities were derived from the first-order moment of the Stokes I LSD profiles of the SPIRou observations (black dots) and from spectral fitting of GRACES (red dot) and Keck spectra (green dots). The blue curve represents the sinusoidal fit with the rotational period fixed at 3.31days. Residuals (squares), computed as the difference between the RV values and the sinusoidal fit, have a standard deviation of 0.27km/s.
Current usage metrics show cumulative count of Article Views (full-text article views including HTML views, PDF and ePub downloads, according to the available data) and Abstracts Views on Vision4Press platform.
Data correspond to usage on the plateform after 2015. The current usage metrics is available 48-96 hours after online publication and is updated daily on week days.
Initial download of the metrics may take a while.