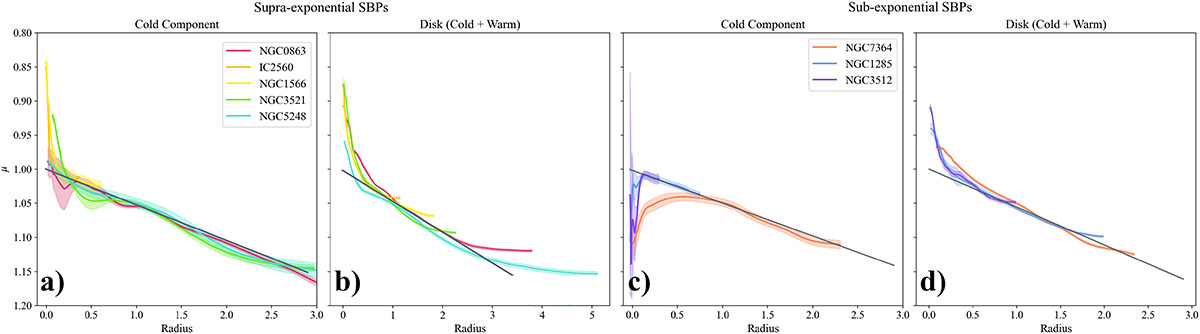
Fig. 1.
Download original image
Surface brightness profiles of the cold (panels a and c) and cold plus warm (panels b and d) orbital components for the galaxy sample normalised by each galaxy’s best-fit exponential disk’s scale length and central surface brightness. Shaded regions indicate 1σ uncertainties, derived from models whose χ2 values lie within 1σ of the best-fit solution. Each line is coloured according to total galaxy mass (reddest curves indicate the most massive systems, bluest the least). Two rightmost panels (‘supra-exponential SBPs’): Galaxies whose cold profiles rise above the exponential in their innermost regions, revealing a ‘nuclear disk” within ∼0.5 RD. Two leftmost panels (‘sub-exponential SBPs’): Galaxies whose cold profiles descend below the exponential (doughnut morphology) within the same region. The standard exponential profile is shown in black. Different colours represent the various galaxies of the sample.
Current usage metrics show cumulative count of Article Views (full-text article views including HTML views, PDF and ePub downloads, according to the available data) and Abstracts Views on Vision4Press platform.
Data correspond to usage on the plateform after 2015. The current usage metrics is available 48-96 hours after online publication and is updated daily on week days.
Initial download of the metrics may take a while.