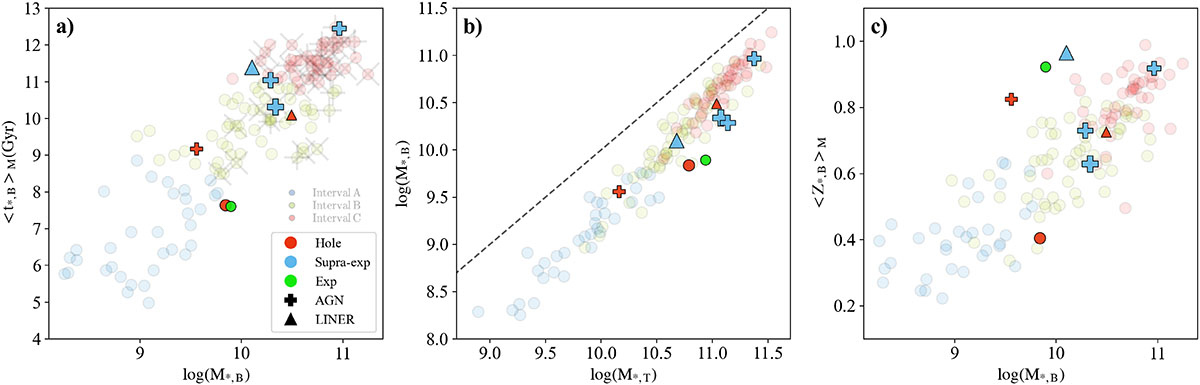
Fig. 2.
Download original image
Comparison of the bulge properties between the reference sample and the galaxies analysed in this work (coloured symbols). The reference sample consists of 135 face-on disk galaxies from the CALIFA survey, shown as transparent circles (including iA, iB, and iC systems): Bulges are classified into these three intervals according to their ⟨δμ9G⟩ values, which trace the fractional contribution of stellar populations younger than 9 Gyr, being highest in iA, intermediate in iB, and lowest in the most evolved iC systems. Panel (a): relationship between bulge stellar mass (ℳ★, B) and mass-weighted stellar age (⟨t★, B⟩ℳ). Panel (b): total stellar mass (ℳ★, T) versus bulge stellar mass. Panel (c): bulge stellar mass versus bulge mass-weighted metallicity (⟨Z★, B⟩ℳ), derived using STARLIGHT, adopting the Z4 library. The vivid markers are colour coded according to the structure of their central cold component (with red, green, blue indicating centrally depleted, exponential, and supra-exponential, respectively). The shape of the markers represents nuclear activity (i.e. circles correspond to non-active galaxies, crosses to AGNs, and triangles to LINERS), and the size indicates the local environmental density.
Current usage metrics show cumulative count of Article Views (full-text article views including HTML views, PDF and ePub downloads, according to the available data) and Abstracts Views on Vision4Press platform.
Data correspond to usage on the plateform after 2015. The current usage metrics is available 48-96 hours after online publication and is updated daily on week days.
Initial download of the metrics may take a while.