Fig. 3.
Download original image
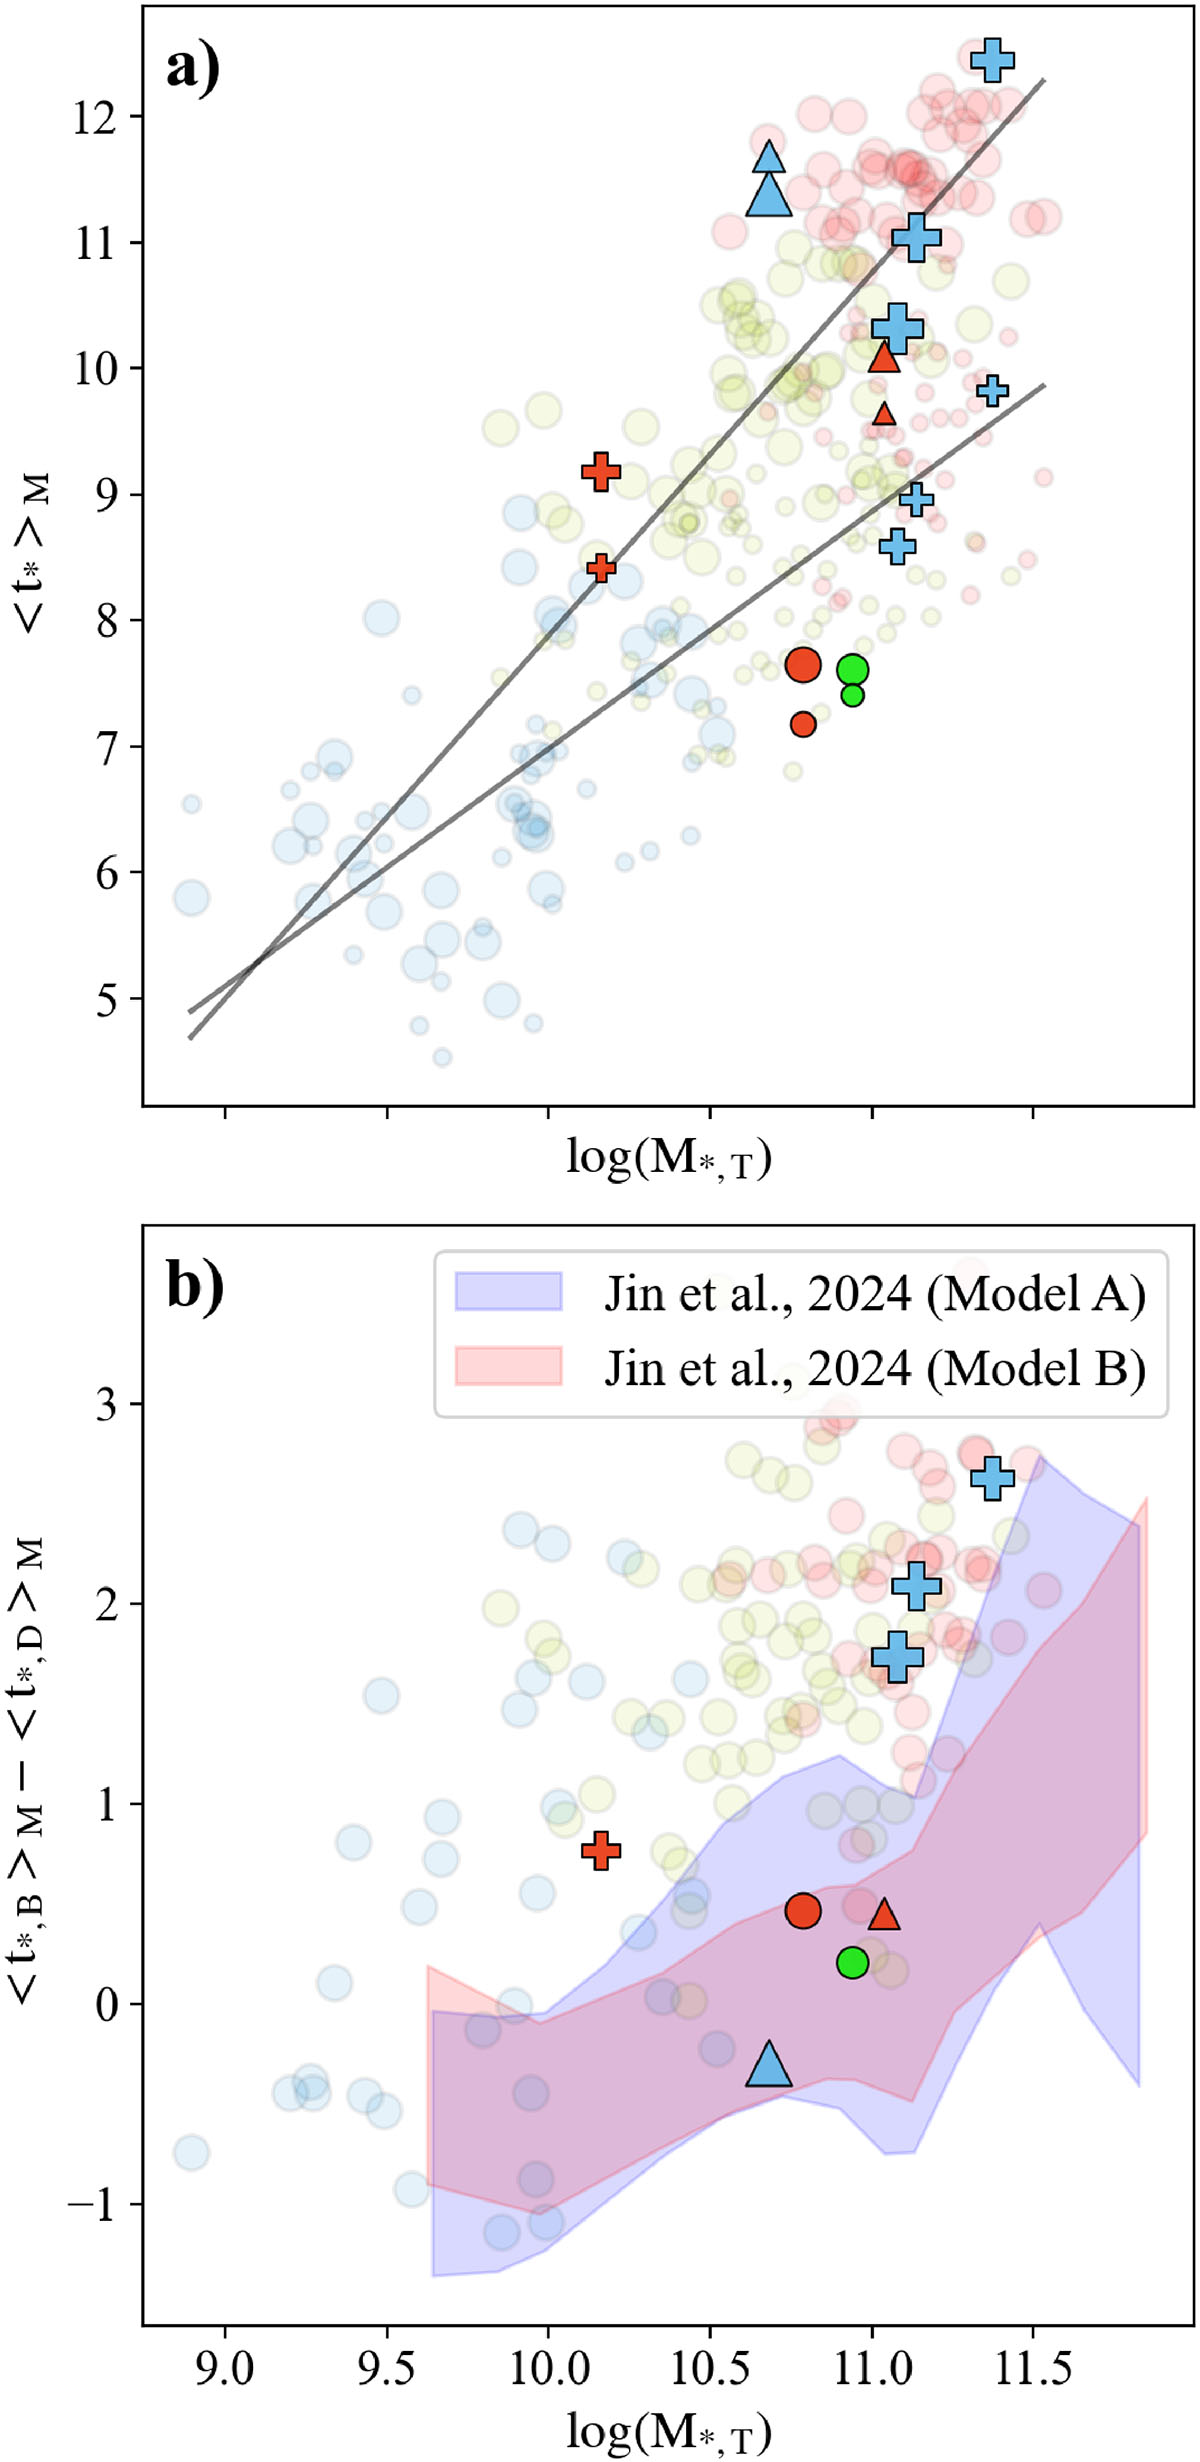
Panel (a): relationship between ℳ★, T and ⟨t★, B⟩ℳ (large markers) and the parent disk (⟨t★, D⟩ℳ, small markers). Panel (b): comparison of ℳ★, T and the mean age difference between bulge and disk components. In panel (b), the regions shaded blue and red depict the age difference between the hot and cold orbit components within the effective radius as a function of stellar mass for two different models, as derived by Jin et al. (2024). Markers follow the same coding as in Fig. 2.
Current usage metrics show cumulative count of Article Views (full-text article views including HTML views, PDF and ePub downloads, according to the available data) and Abstracts Views on Vision4Press platform.
Data correspond to usage on the plateform after 2015. The current usage metrics is available 48-96 hours after online publication and is updated daily on week days.
Initial download of the metrics may take a while.