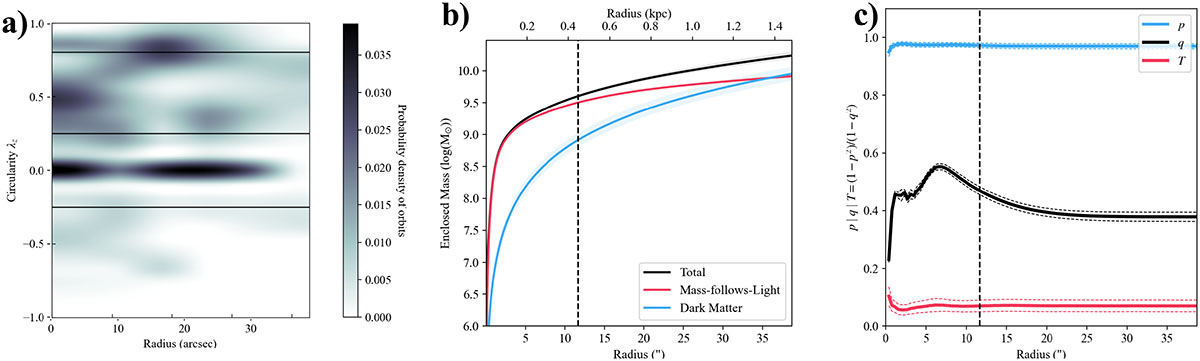
Fig. A.5.
Download original image
Panel (a): Circularity plot showing the distribution of stellar orbits in the best-fit dynamical model of NGC 3521. Horizontal lines denote the separations between cold, warm, hot, and counter-rotating orbits, with default cut values of λz < 0.8; 0.8 > λz > 0.25. Panel (b): Enclosed mass profiles for the stellar (mass-follows-light) component, dark matter, and their sum. Panel (c): Intrinsic axis ratios q and p as functions of distance from the centre; T quantifies triaxiality. Vertical dashed lines indicate the bulge radius.
Current usage metrics show cumulative count of Article Views (full-text article views including HTML views, PDF and ePub downloads, according to the available data) and Abstracts Views on Vision4Press platform.
Data correspond to usage on the plateform after 2015. The current usage metrics is available 48-96 hours after online publication and is updated daily on week days.
Initial download of the metrics may take a while.