Open Access
Fig. A.3.
Download original image
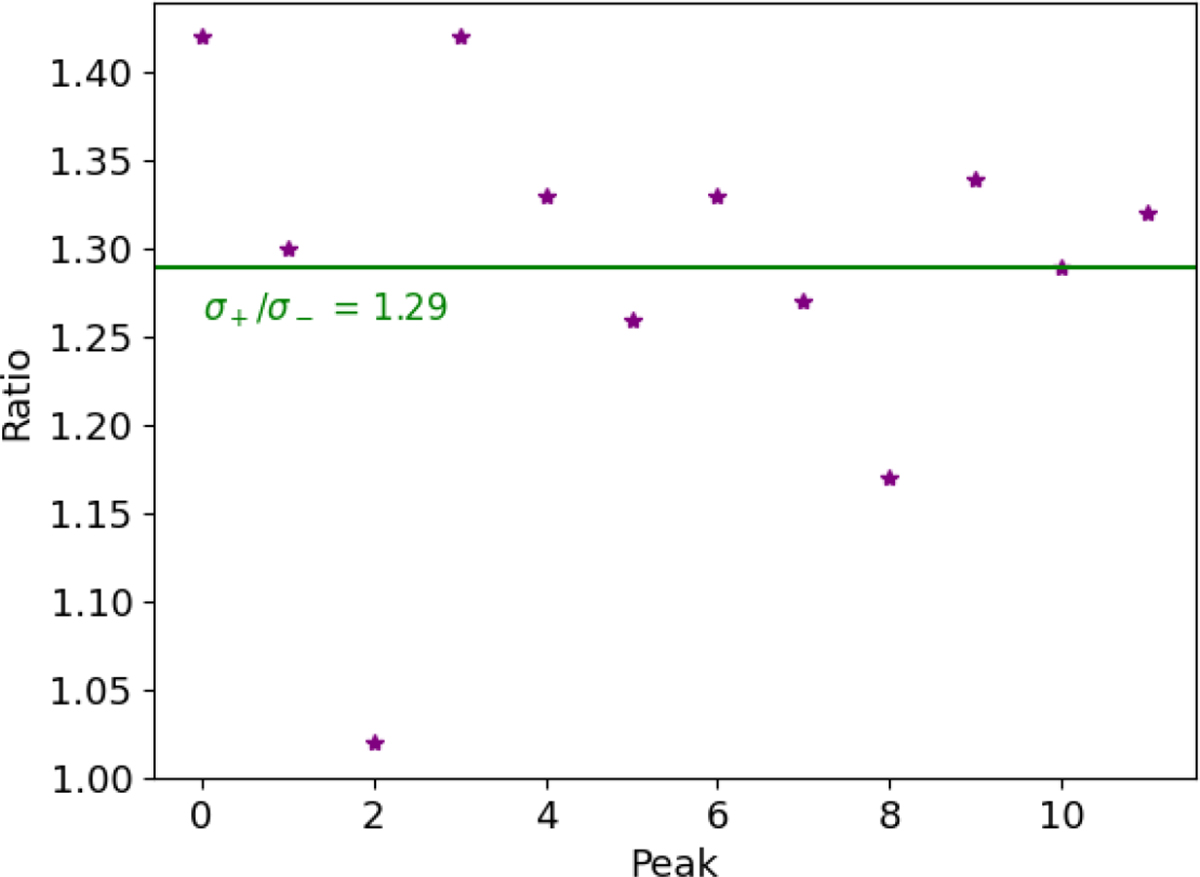
Decline and rise times for multiple eruptions in eRO-QPE1 from the epoch of 19th August 2020. The green line represents the average. The values of σ+ and σ− were obtained by fitting the eruption count rates by an analytical function referenced in Sect. 3.2. The count rates were kindly shared by R. Arcodia.
Current usage metrics show cumulative count of Article Views (full-text article views including HTML views, PDF and ePub downloads, according to the available data) and Abstracts Views on Vision4Press platform.
Data correspond to usage on the plateform after 2015. The current usage metrics is available 48-96 hours after online publication and is updated daily on week days.
Initial download of the metrics may take a while.