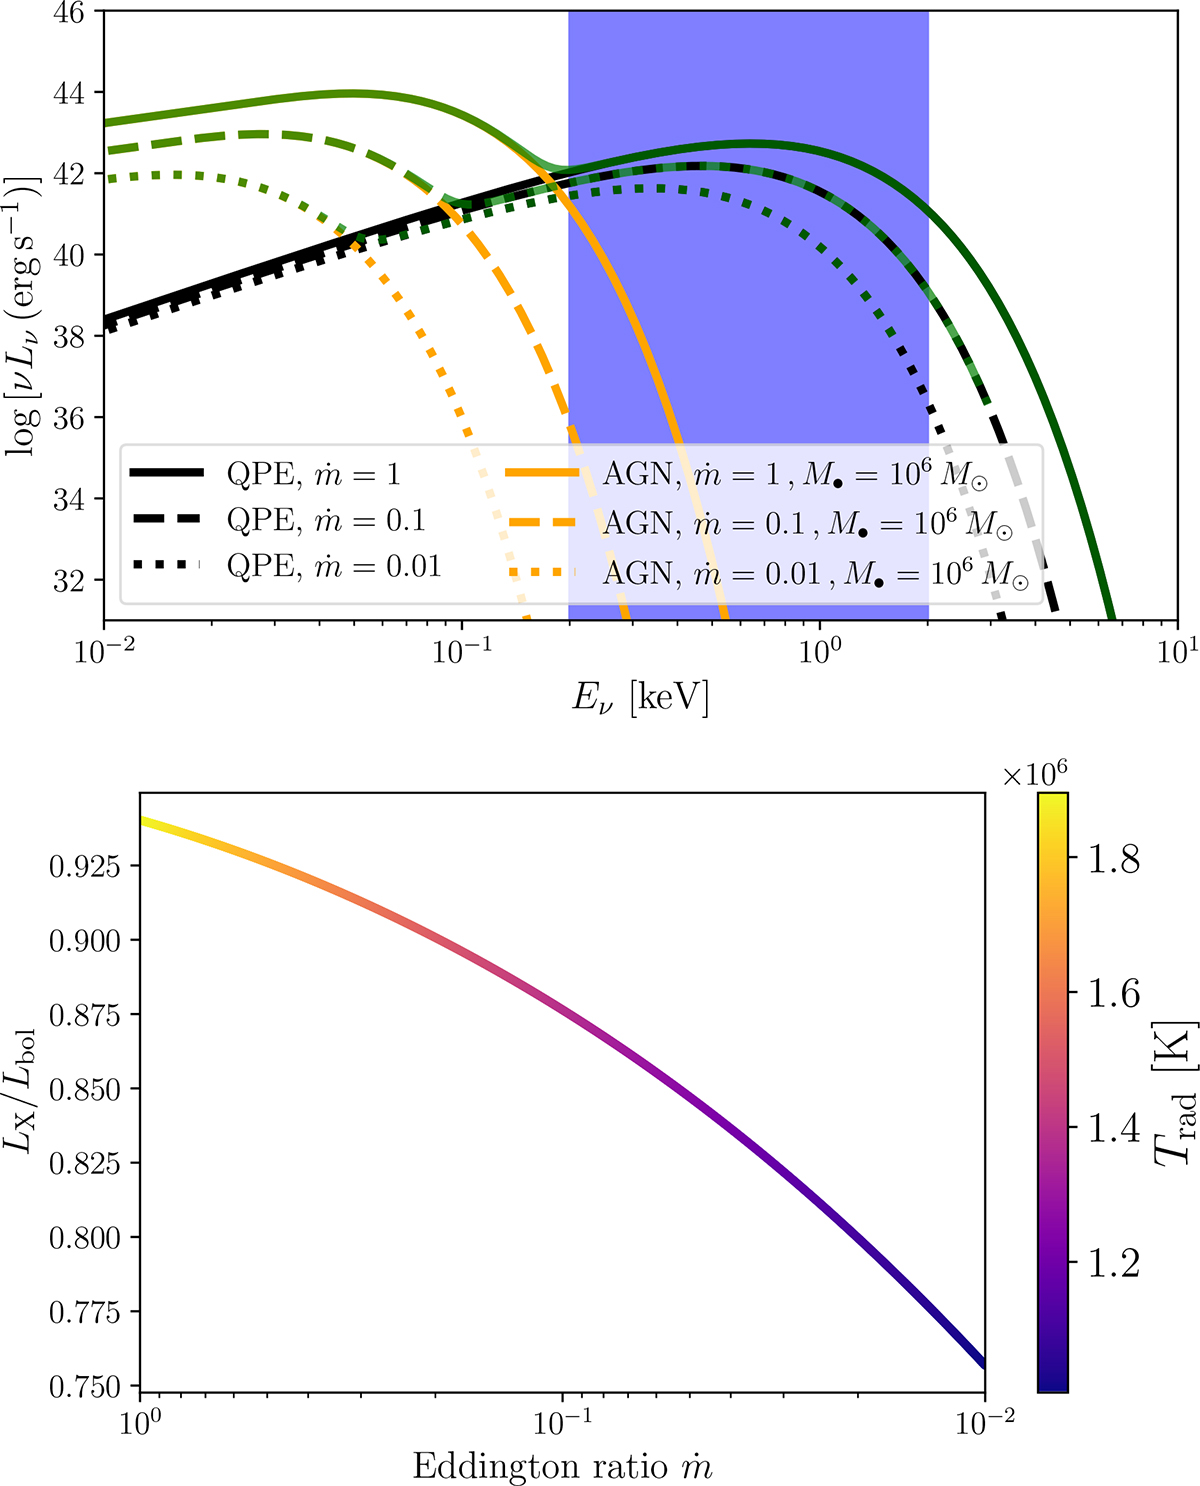
Fig. B.1.
Download original image
Evolution of the QPE spectral energy distribution with the relative accretion rate. Top panel: Blackbody spectra of ejected plasmoids (black lines) for different relative accretion rates (ṁ = 1−0.01), which influence the post-shock radiation temperature. The blue shaded rectangle depicts the spectral range between 0.2 and 2 keV. For comparison, we also depict corresponding AGN spectra (standard accretion disks, orange colors) and their sum with QPE spectra (green lines). Bottom panel: Dependence of the ratio between the X-ray (0.2-2 keV) luminosity and the bolometric luminosity, Lx/Lbol, as a function of the relative accretion rate. The curve is color-coded using the post-shock radiation temperature.
Current usage metrics show cumulative count of Article Views (full-text article views including HTML views, PDF and ePub downloads, according to the available data) and Abstracts Views on Vision4Press platform.
Data correspond to usage on the plateform after 2015. The current usage metrics is available 48-96 hours after online publication and is updated daily on week days.
Initial download of the metrics may take a while.