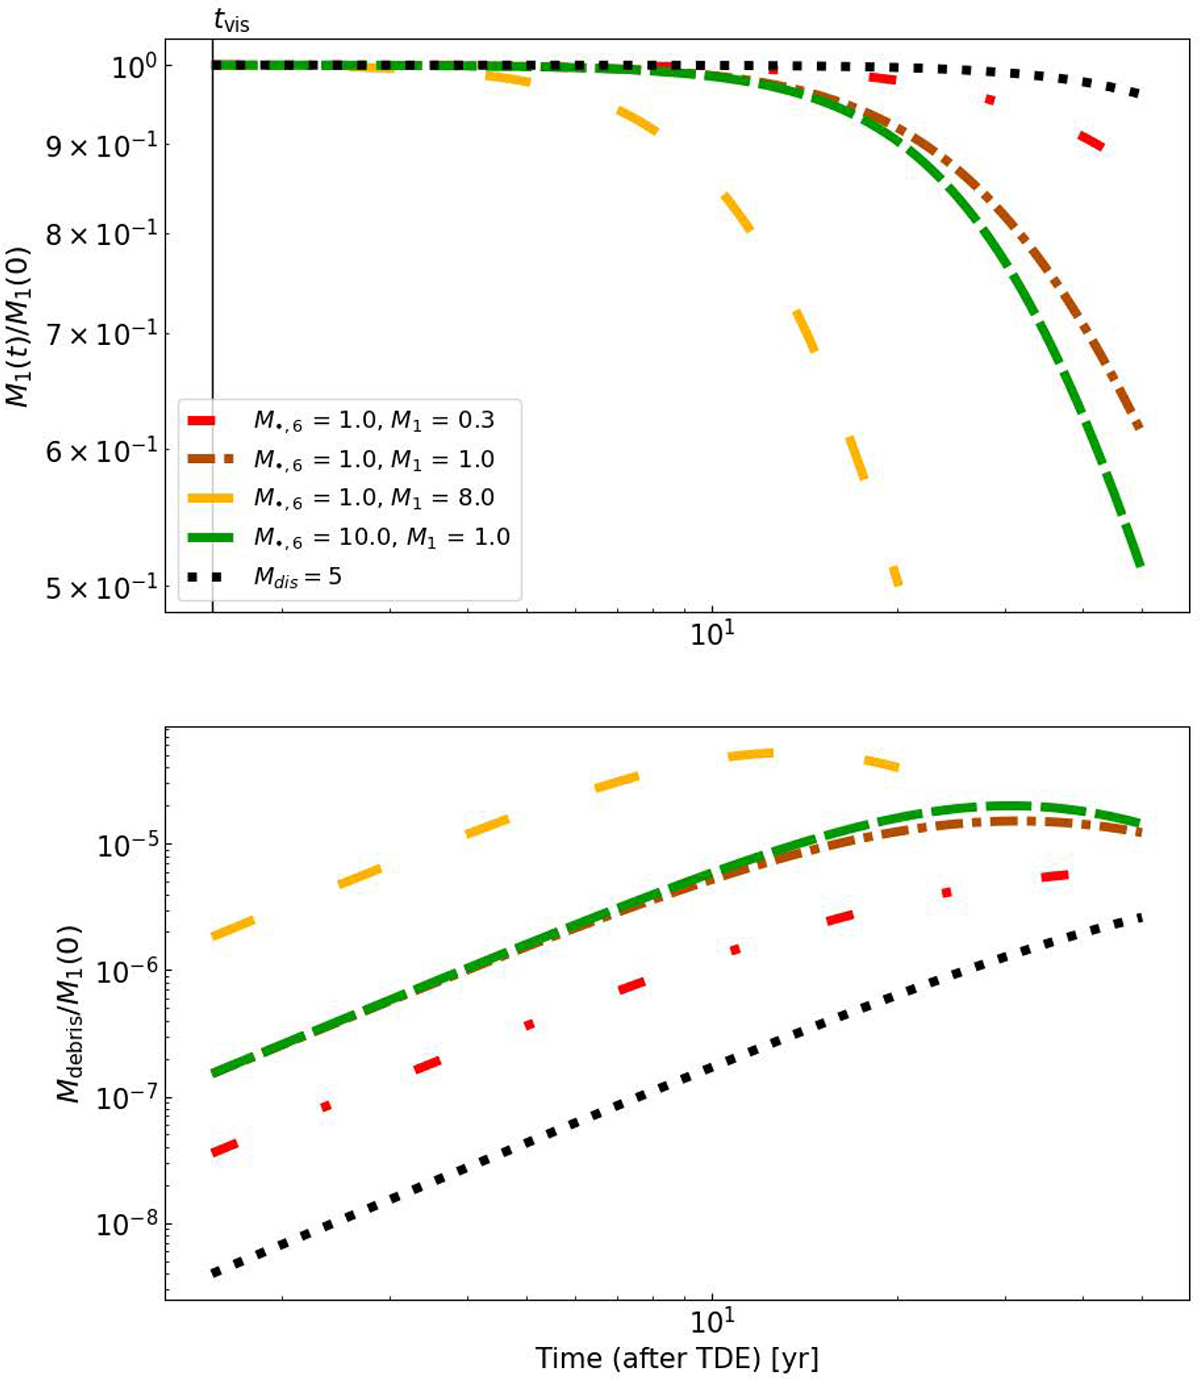
Fig. 6.
Download original image
Ablation rate of the stellar mass after tvis. Top: Remaining stellar mass scaled to M★ = M1(0) evolves with time. Bottom: Mass of the debris lost during the disk passages, scaled to M★ again. The curves that reach the half on the y-axis (top panel) do not continue further since the star lost a significant amount of mass. We started the mass loss after tvis, which is a point in time where ρd in a post-TDE disk starts to decay with a power-law of n. The first four curves are for the Mdis = 1, but the last one is for Mdis = 5 and M•, 6 = 1, M1 = 1.
Current usage metrics show cumulative count of Article Views (full-text article views including HTML views, PDF and ePub downloads, according to the available data) and Abstracts Views on Vision4Press platform.
Data correspond to usage on the plateform after 2015. The current usage metrics is available 48-96 hours after online publication and is updated daily on week days.
Initial download of the metrics may take a while.