Fig. 1
Download original image
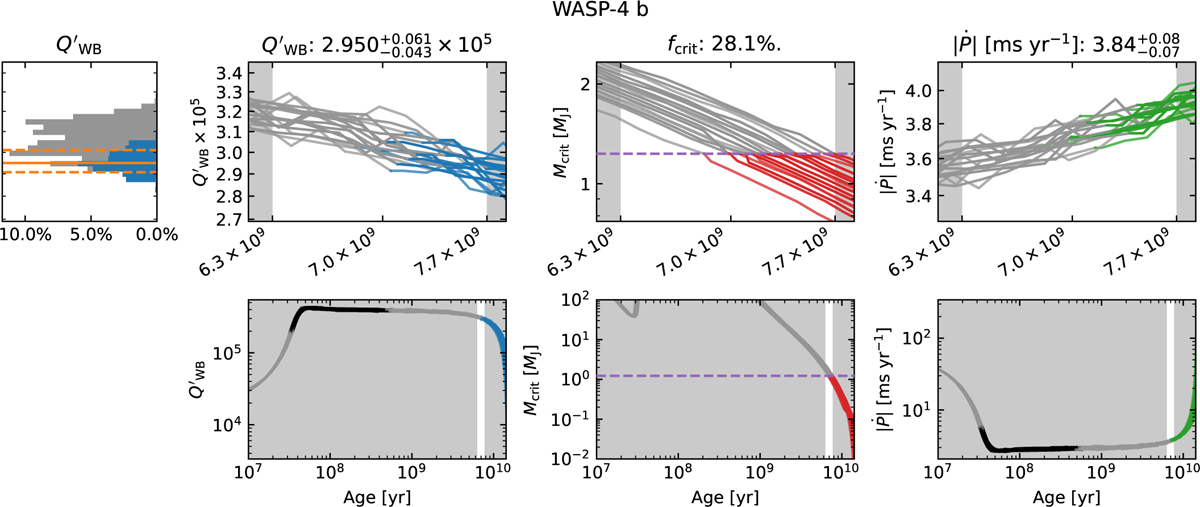
Predictions of tidal interactions in the WASP-4 system, shown as an illustrative example of our modelling outcome. The first column shows the histogram of Q′WB values. The second column shows the evolution of Q′WB, with the top panel zoomed in around the 1σ age estimate. Each line corresponds to one realisation of stellar parameters. Black lines indicate phases when the host’s core is convective, grey lines mark phases when the host’s core is radiative but wave breaking is not expected, and blue lines denote phases when the host’s core is radiative and wave breaking occurs. The estimated Q′WB with uncertainties is shown above the column. The third column shows the evolution of Mcrit, with red lines indicating phases when the host’s core is radiative and wave breaking occurs. The estimated probability of wave breaking is shown above the column. The fourth column presents the evolution of Ṗ, with green lines marking phases when the host s core is radiative and wave breaking occurs. The estimated value of Ṗ with uncertainties is displayed above the column.
Current usage metrics show cumulative count of Article Views (full-text article views including HTML views, PDF and ePub downloads, according to the available data) and Abstracts Views on Vision4Press platform.
Data correspond to usage on the plateform after 2015. The current usage metrics is available 48-96 hours after online publication and is updated daily on week days.
Initial download of the metrics may take a while.