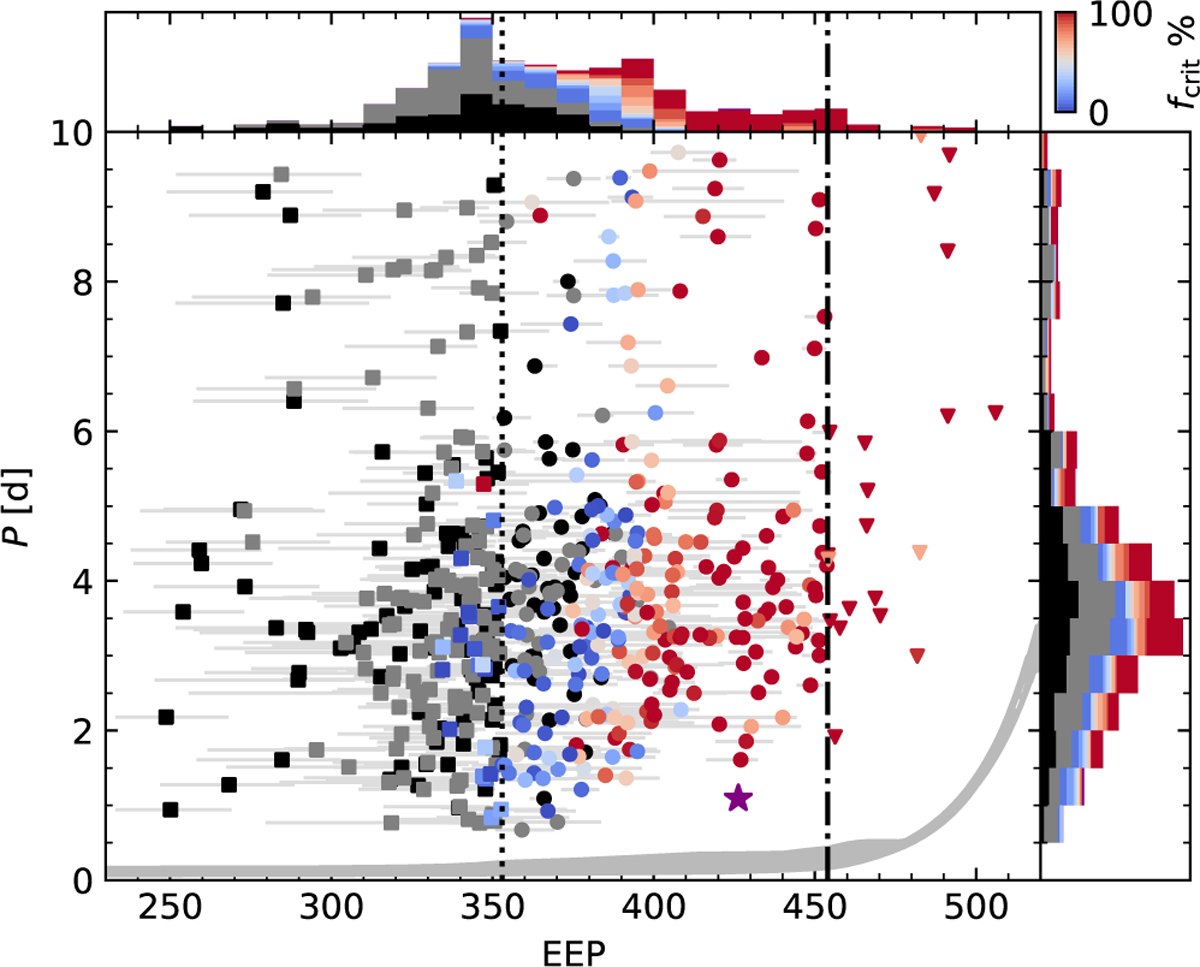
Fig. 3
Download original image
Joint plot of EEP and orbital period, P, for the studied systems. The colour of the points, from blue to red, corresponds to the probability of wave breaking, fcrit, as indicated by the colour bar in the top-right corner. Grey points denote systems with host stars with radiative cores and the wave breaking criterion being unfulfilled, while black points indicate systems with convective core stars. The purple point is the WASP-12 subgiant scenario, as described in Sect. 4.5. The shape of the points indicates the evolutionary stage of the host: squares for systems before the IAMS, circles for those between the IAMS and TAMS, and triangles for those beyond the TAMS. The dotted and dash-dotted vertical lines mark IAMS and TAMS evolutionary phases, respectively. The colour scale in the histograms corresponds to the colour of the points. The grey lines show the engulfment period for stars with masses between 0.8 and 1.5 M⊙.
Current usage metrics show cumulative count of Article Views (full-text article views including HTML views, PDF and ePub downloads, according to the available data) and Abstracts Views on Vision4Press platform.
Data correspond to usage on the plateform after 2015. The current usage metrics is available 48-96 hours after online publication and is updated daily on week days.
Initial download of the metrics may take a while.