Fig. 6
Download original image
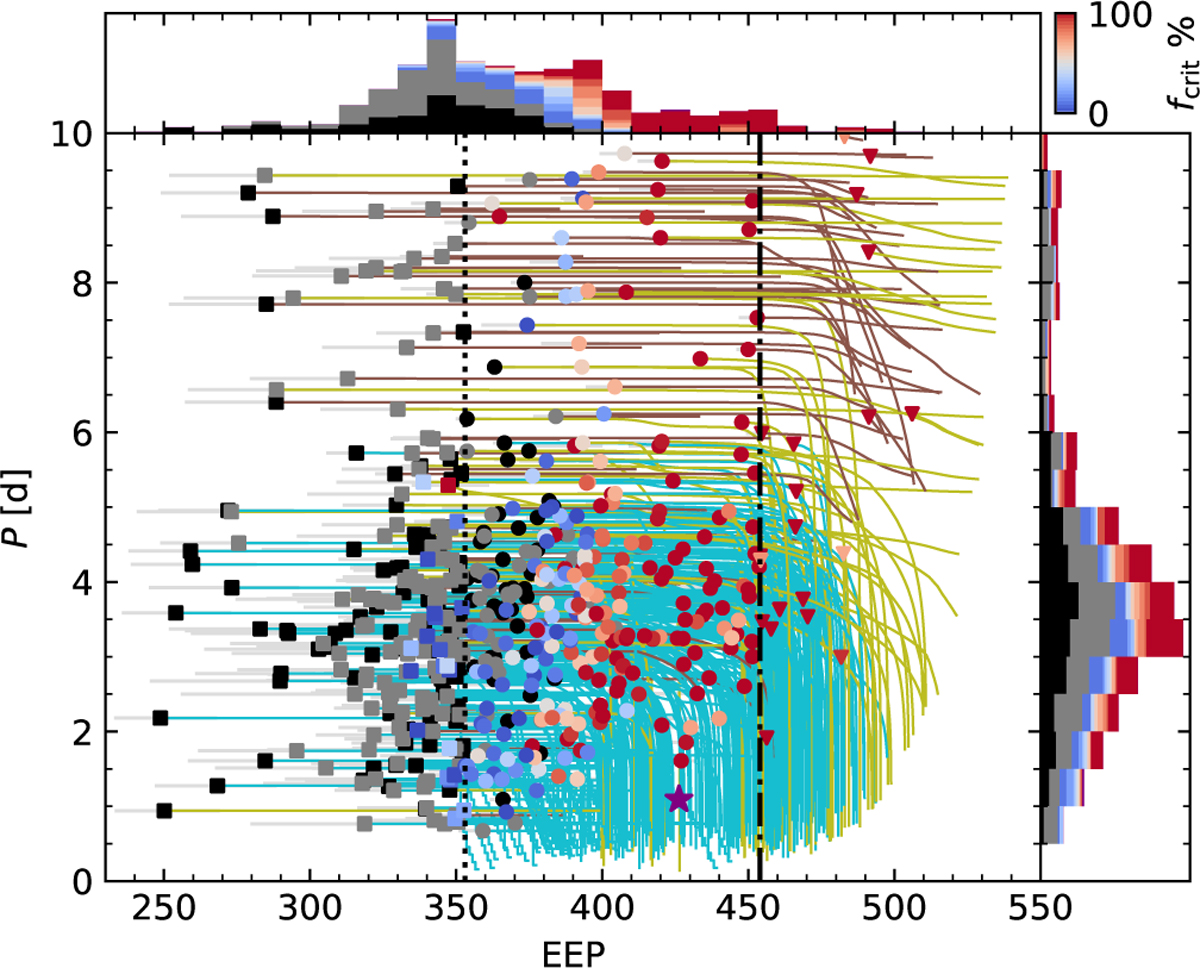
Same as Fig. 3, but including the evolutionary tracks of planetary orbits for all systems in our sample. The coloured solid lines trace the orbital evolution driven by wave breaking: olive lines indicate systems ending in engulfment, cyan lines show those disrupted at the Roche limit, and brown lines denote tracks that terminate early due to the limits of the MESA grid.
Current usage metrics show cumulative count of Article Views (full-text article views including HTML views, PDF and ePub downloads, according to the available data) and Abstracts Views on Vision4Press platform.
Data correspond to usage on the plateform after 2015. The current usage metrics is available 48-96 hours after online publication and is updated daily on week days.
Initial download of the metrics may take a while.