Open Access
Fig. 8
Download original image
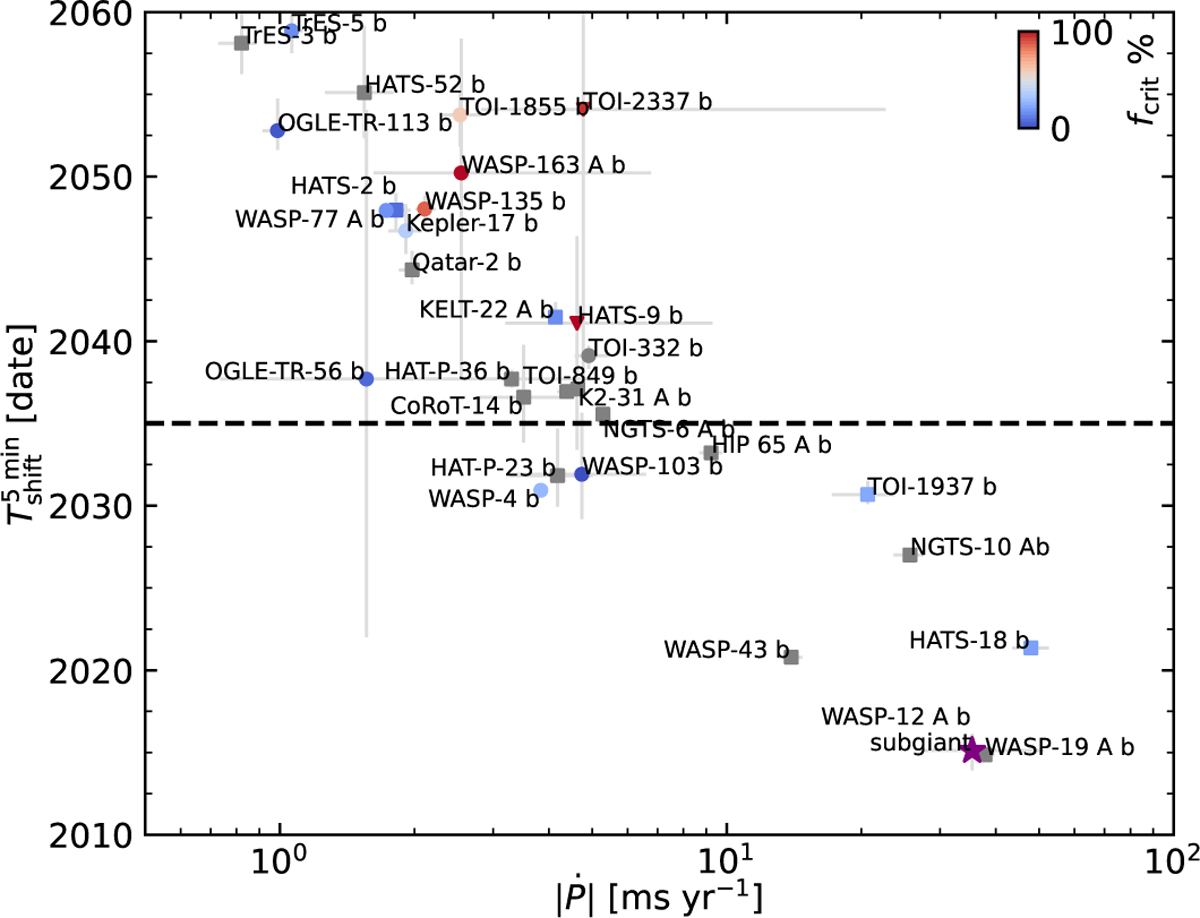
Predicted year at which the cumulative shift in central transit times reaches 5 minutes, plotted as a function of the absolute value of the orbital period change |P| due to wave breaking. The horizontal black line indicates the year 2035.
Current usage metrics show cumulative count of Article Views (full-text article views including HTML views, PDF and ePub downloads, according to the available data) and Abstracts Views on Vision4Press platform.
Data correspond to usage on the plateform after 2015. The current usage metrics is available 48-96 hours after online publication and is updated daily on week days.
Initial download of the metrics may take a while.