Open Access
Fig. B.1
Download original image
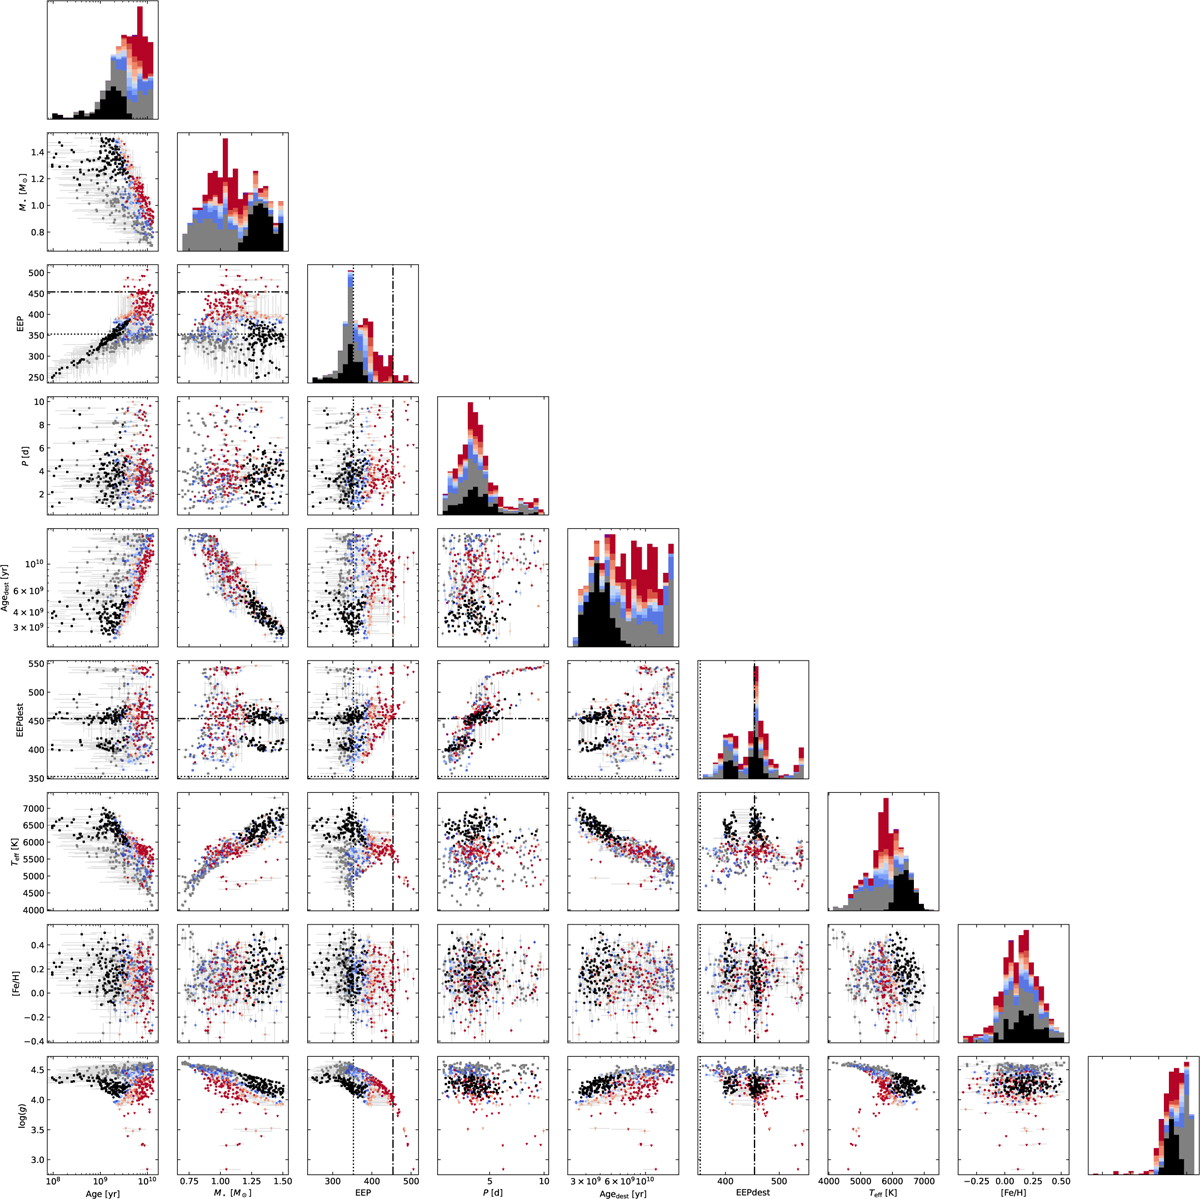
Mosaic of selected parameters for the studied systems, illustrating correlations between stellar, planetary, and tidal properties derived from our modelling. The dotted and dash-dotted vertical lines on EEP and EEPdest plots mark IAMS and TAMS evolutionary phases, respectively.
Current usage metrics show cumulative count of Article Views (full-text article views including HTML views, PDF and ePub downloads, according to the available data) and Abstracts Views on Vision4Press platform.
Data correspond to usage on the plateform after 2015. The current usage metrics is available 48-96 hours after online publication and is updated daily on week days.
Initial download of the metrics may take a while.