Fig. 10
Download original image
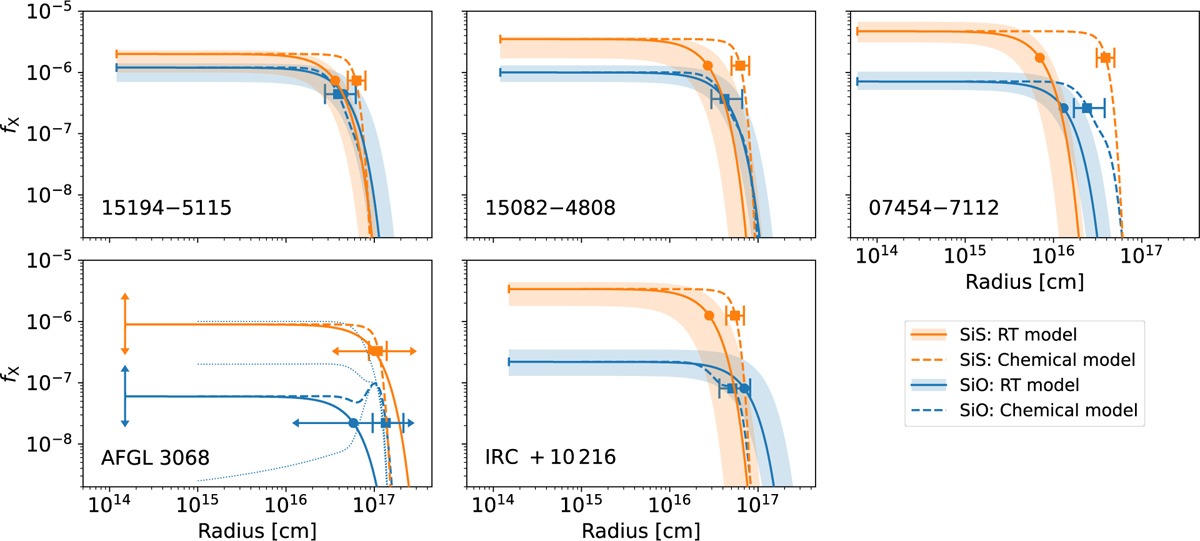
Comparison of abundance profiles obtained from RT modelling (solid lines with shaded 1σ uncertainties) and chemical modelling (dashed lines) for SiO and SiS. The circles denote the Re of the respective RT models and the squares mark the Re of the chemical models. The arrows denote open error bars, indicating that the abundance profile has not been well constrained. The error bars on the chemical model Re denote the estimated uncertainty in the chemical models based on reaction rate uncertainties (Van de Sande et al. 2025). The blue dotted lines for AFGL 3068 show chemical model abundance profiles with different initial SiO abundances (1.0e-6, 2.0e-7, 2.5e-9).
Current usage metrics show cumulative count of Article Views (full-text article views including HTML views, PDF and ePub downloads, according to the available data) and Abstracts Views on Vision4Press platform.
Data correspond to usage on the plateform after 2015. The current usage metrics is available 48-96 hours after online publication and is updated daily on week days.
Initial download of the metrics may take a while.