Fig. 3
Download original image
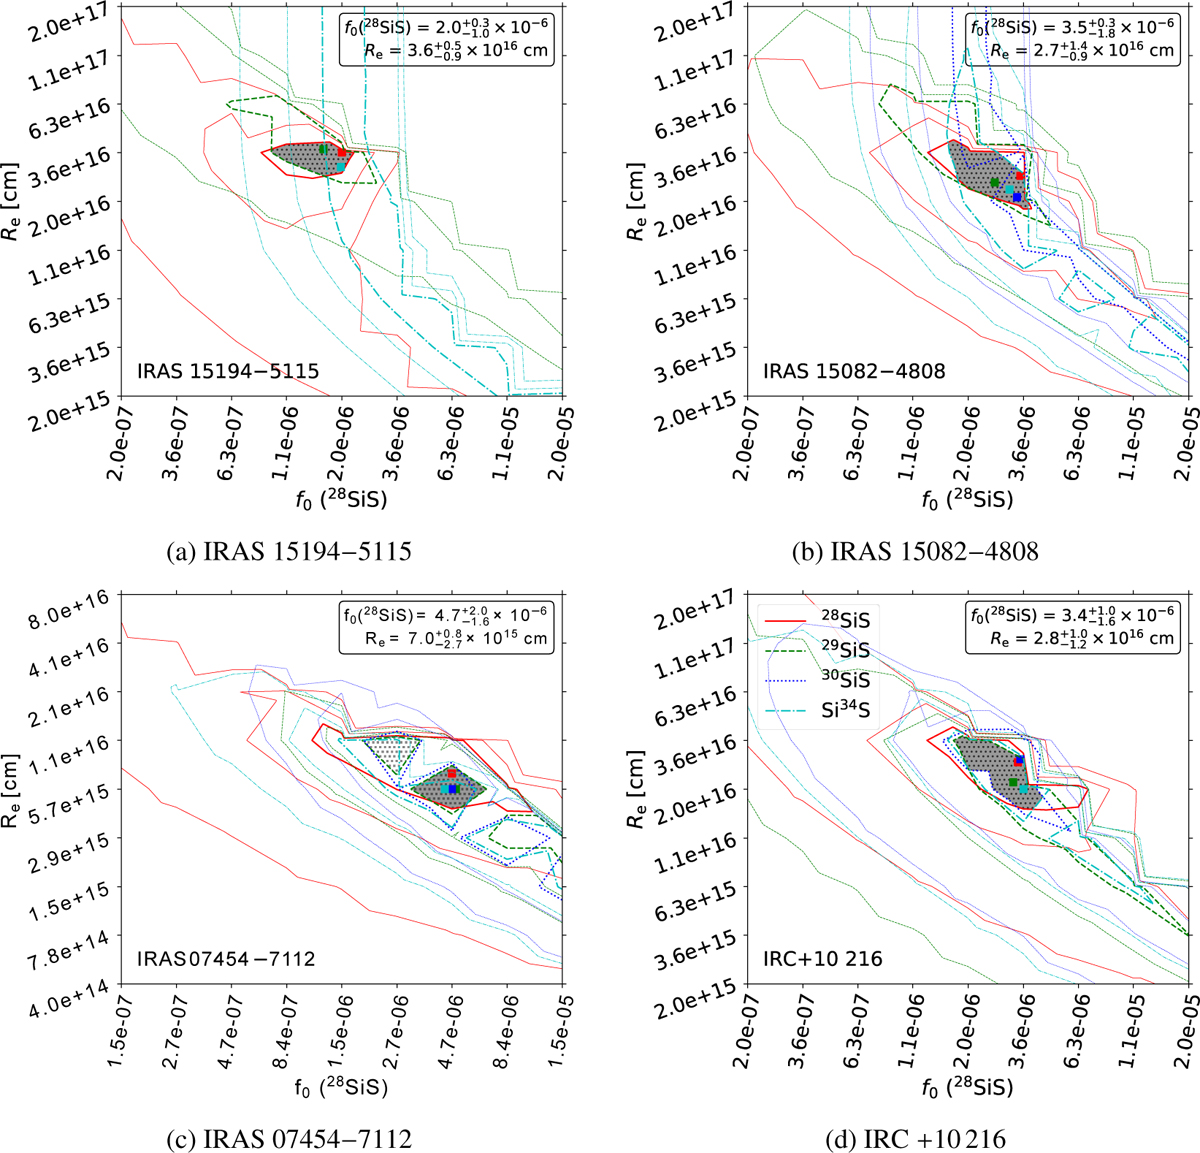
Grid results for SiS RT models for four stars of the sample. As in Fig. 1, but for 28SiS (red), 29SiS (green), 30SiS (blue), and Si34S (cyan). For IRAS 07454–7112, the contours shown are 2, 3, and 4σ (see Sect. 4.2.3). See Sect. 4.2 for descriptions of the hatched ‘best-fit’ regions for the individual sources. The x-axis ticks show 28SiS abundances. The 29SiS, 30SiS, and Si34S abundances at each point of the grid are given by its 28SiS abundance divided by 20, 30, and 22, respectively (see Sect. 3.2).
Current usage metrics show cumulative count of Article Views (full-text article views including HTML views, PDF and ePub downloads, according to the available data) and Abstracts Views on Vision4Press platform.
Data correspond to usage on the plateform after 2015. The current usage metrics is available 48-96 hours after online publication and is updated daily on week days.
Initial download of the metrics may take a while.