Open Access
Fig. 5
Download original image
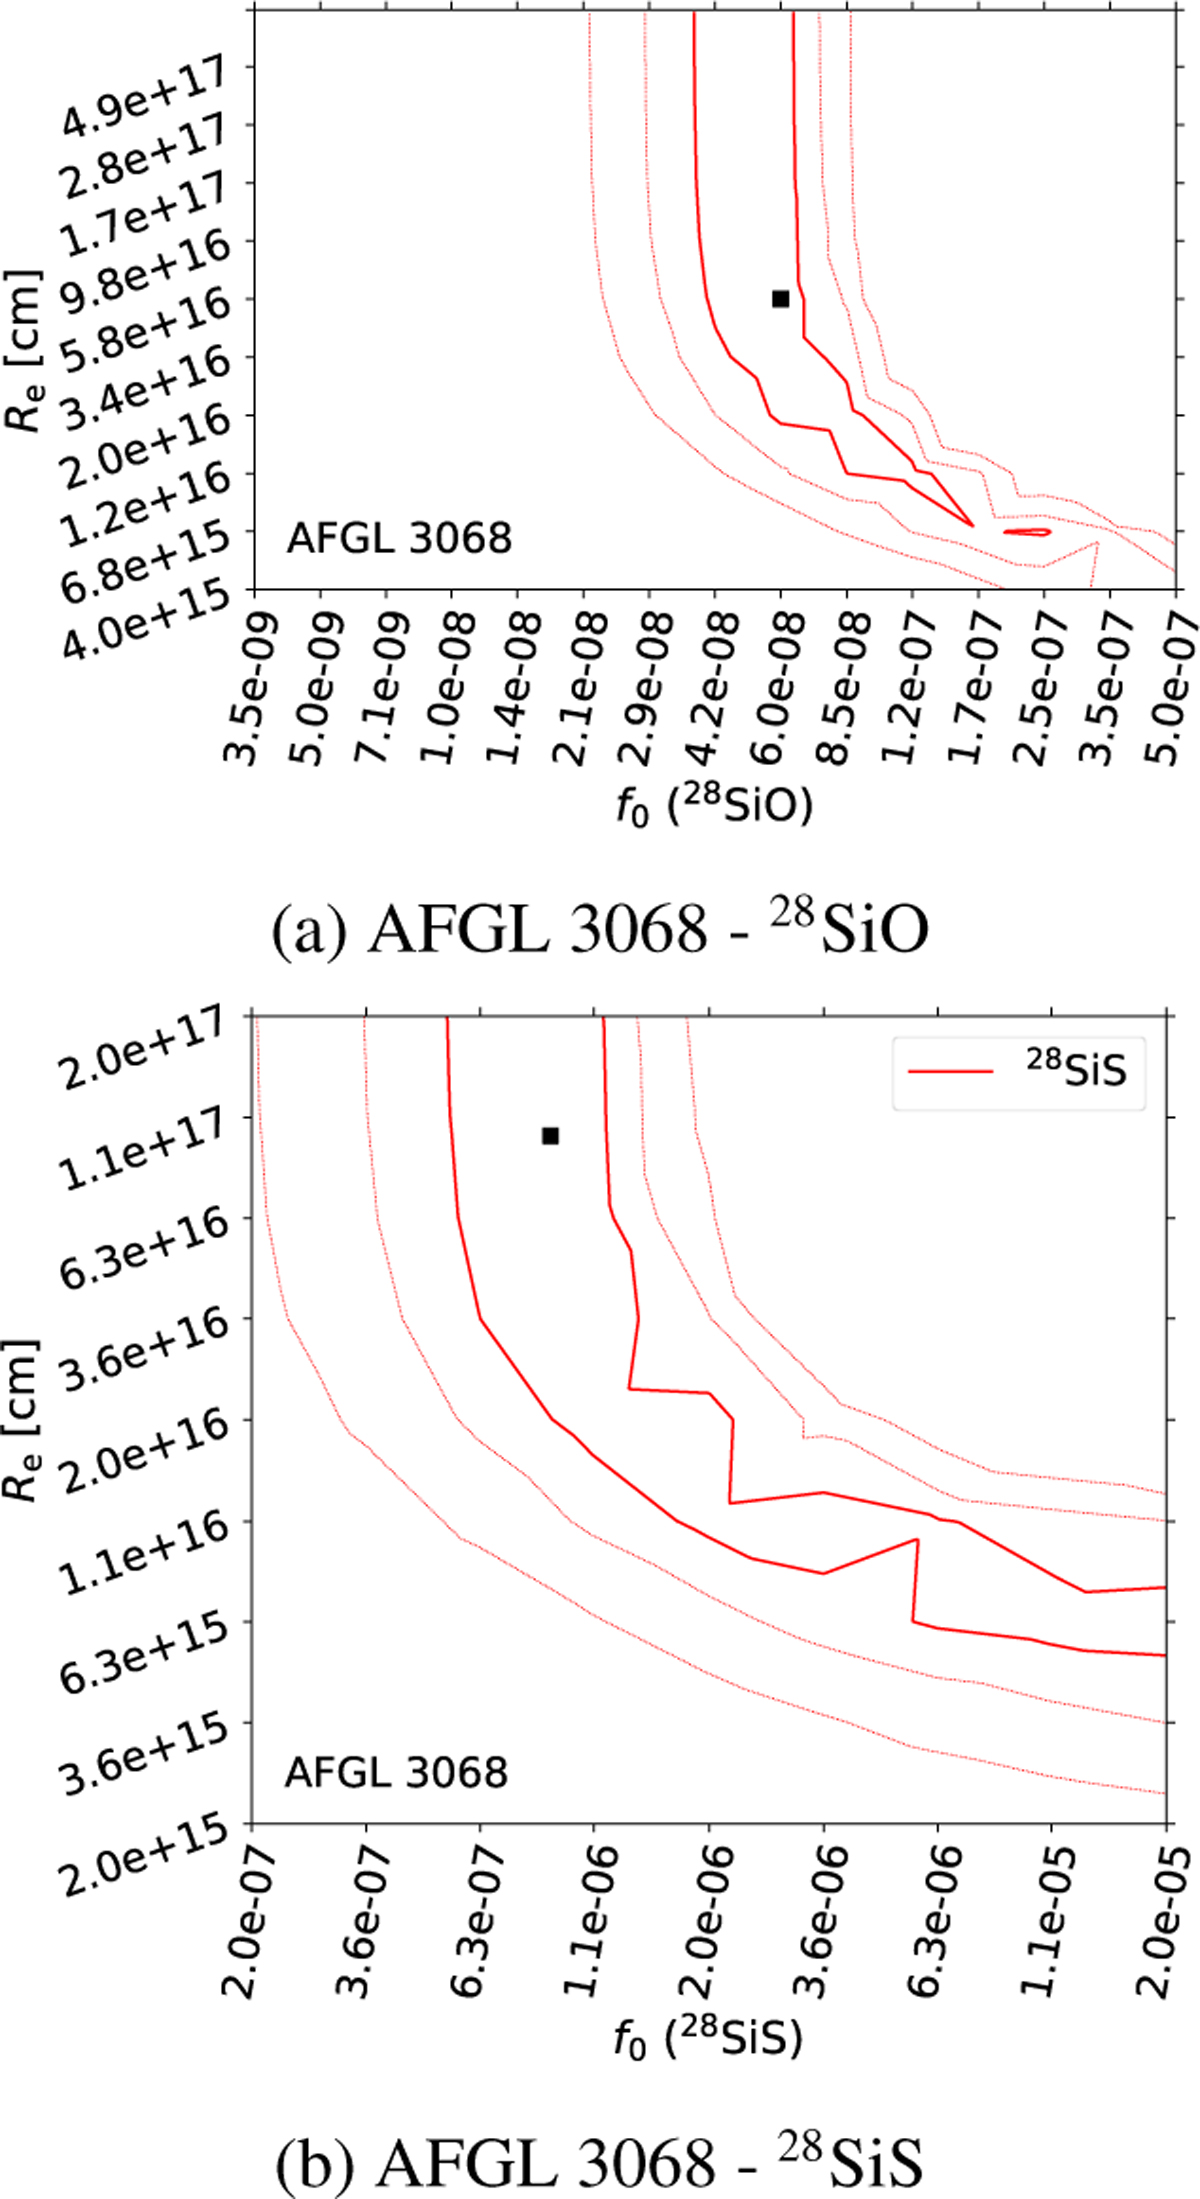
SiO and SiS grid results for AFGL 3068. The 1, 2, and 3σ contours in the χ2 space are shown for (a) 28SiO and (b) 28SiS. The degeneracy and lack of strong constraints are due to the non-availability of spatially resolved data (see text). The black square marks the overall ‘best-fit’ model.
Current usage metrics show cumulative count of Article Views (full-text article views including HTML views, PDF and ePub downloads, according to the available data) and Abstracts Views on Vision4Press platform.
Data correspond to usage on the plateform after 2015. The current usage metrics is available 48-96 hours after online publication and is updated daily on week days.
Initial download of the metrics may take a while.