Fig. 6
Download original image
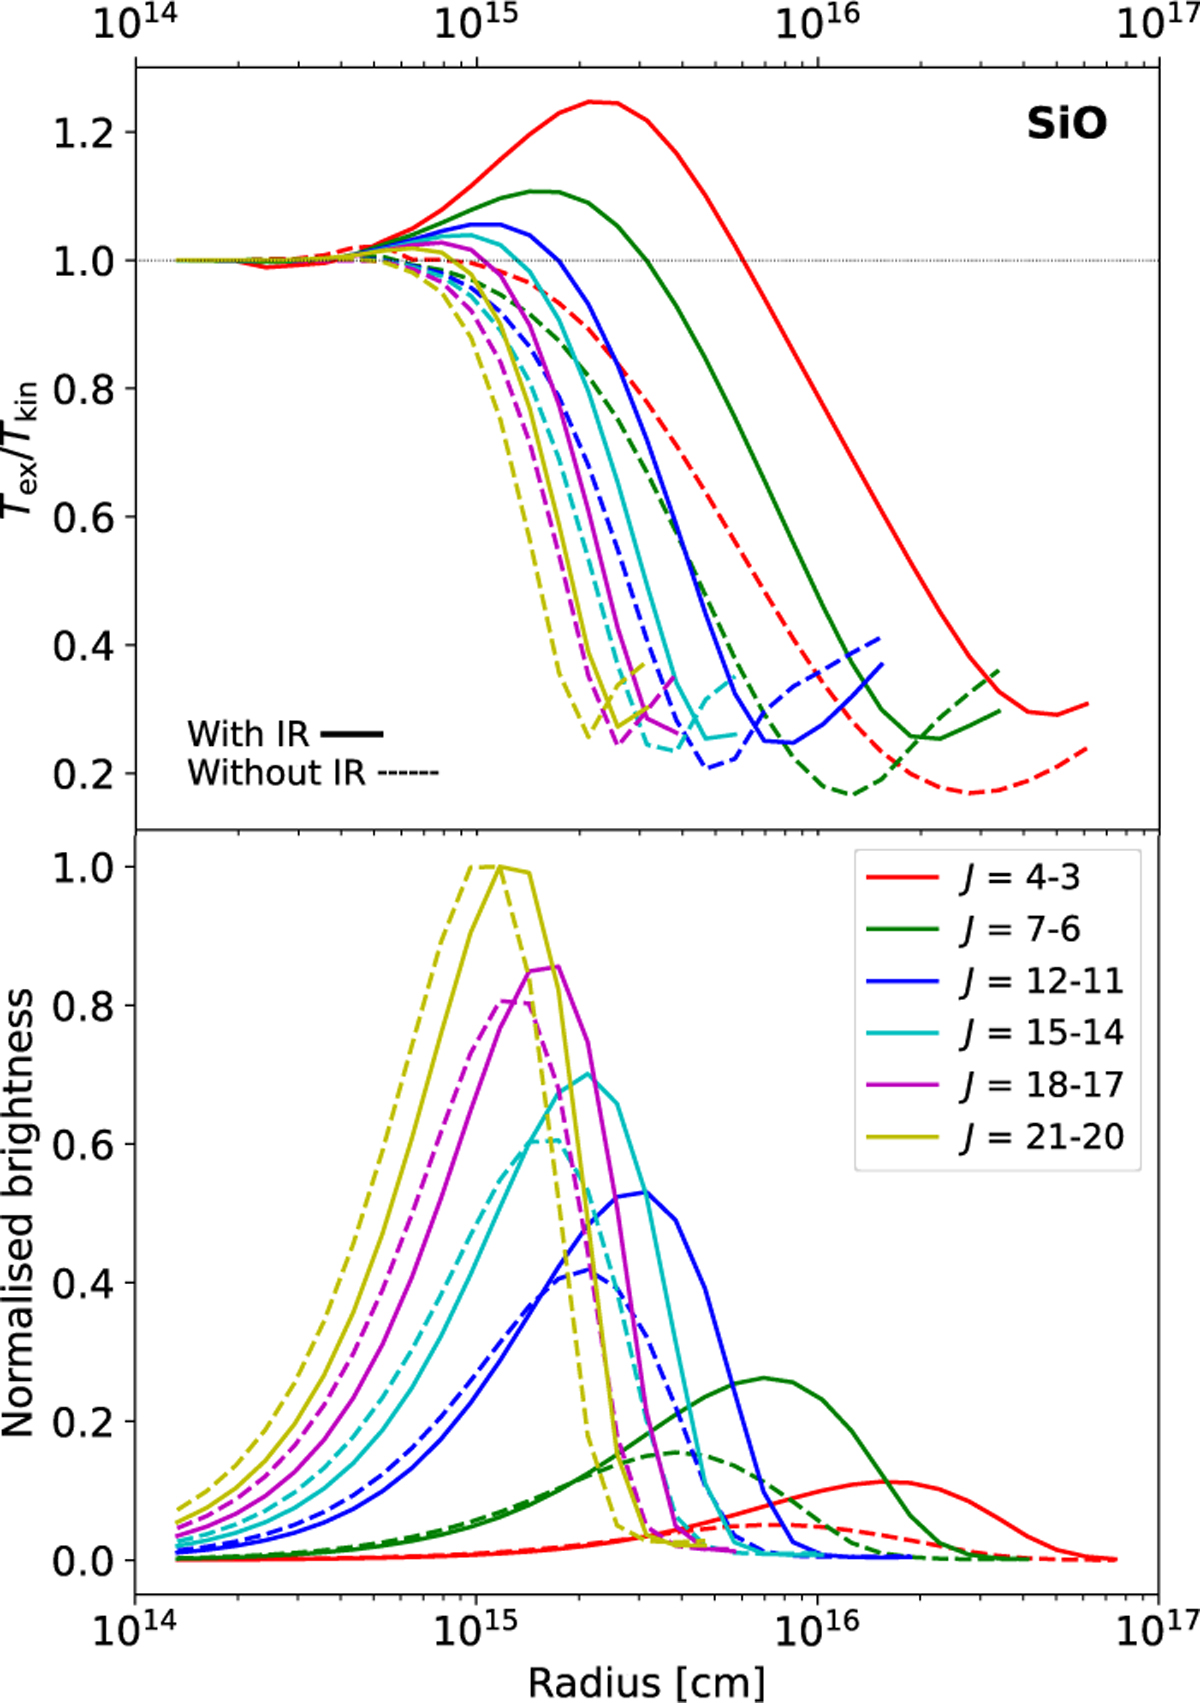
Ratio of the excitation temperature (Tex) and the kinetic temperature (Tkin) for various low- and high-J SiO transitions (top), and their corresponding line-emitting regions (bottom), as functions of radius across the CSE, from the best-fit model for IRAS 15194–5115. The solid lines are from a model that takes into account IR pumping, while the dashed lines are from a model that does not, but is otherwise identical. The line-emitting regions are normalised to the peak of the emitting region of the highest J transition shown.
Current usage metrics show cumulative count of Article Views (full-text article views including HTML views, PDF and ePub downloads, according to the available data) and Abstracts Views on Vision4Press platform.
Data correspond to usage on the plateform after 2015. The current usage metrics is available 48-96 hours after online publication and is updated daily on week days.
Initial download of the metrics may take a while.