Fig. 8
Download original image
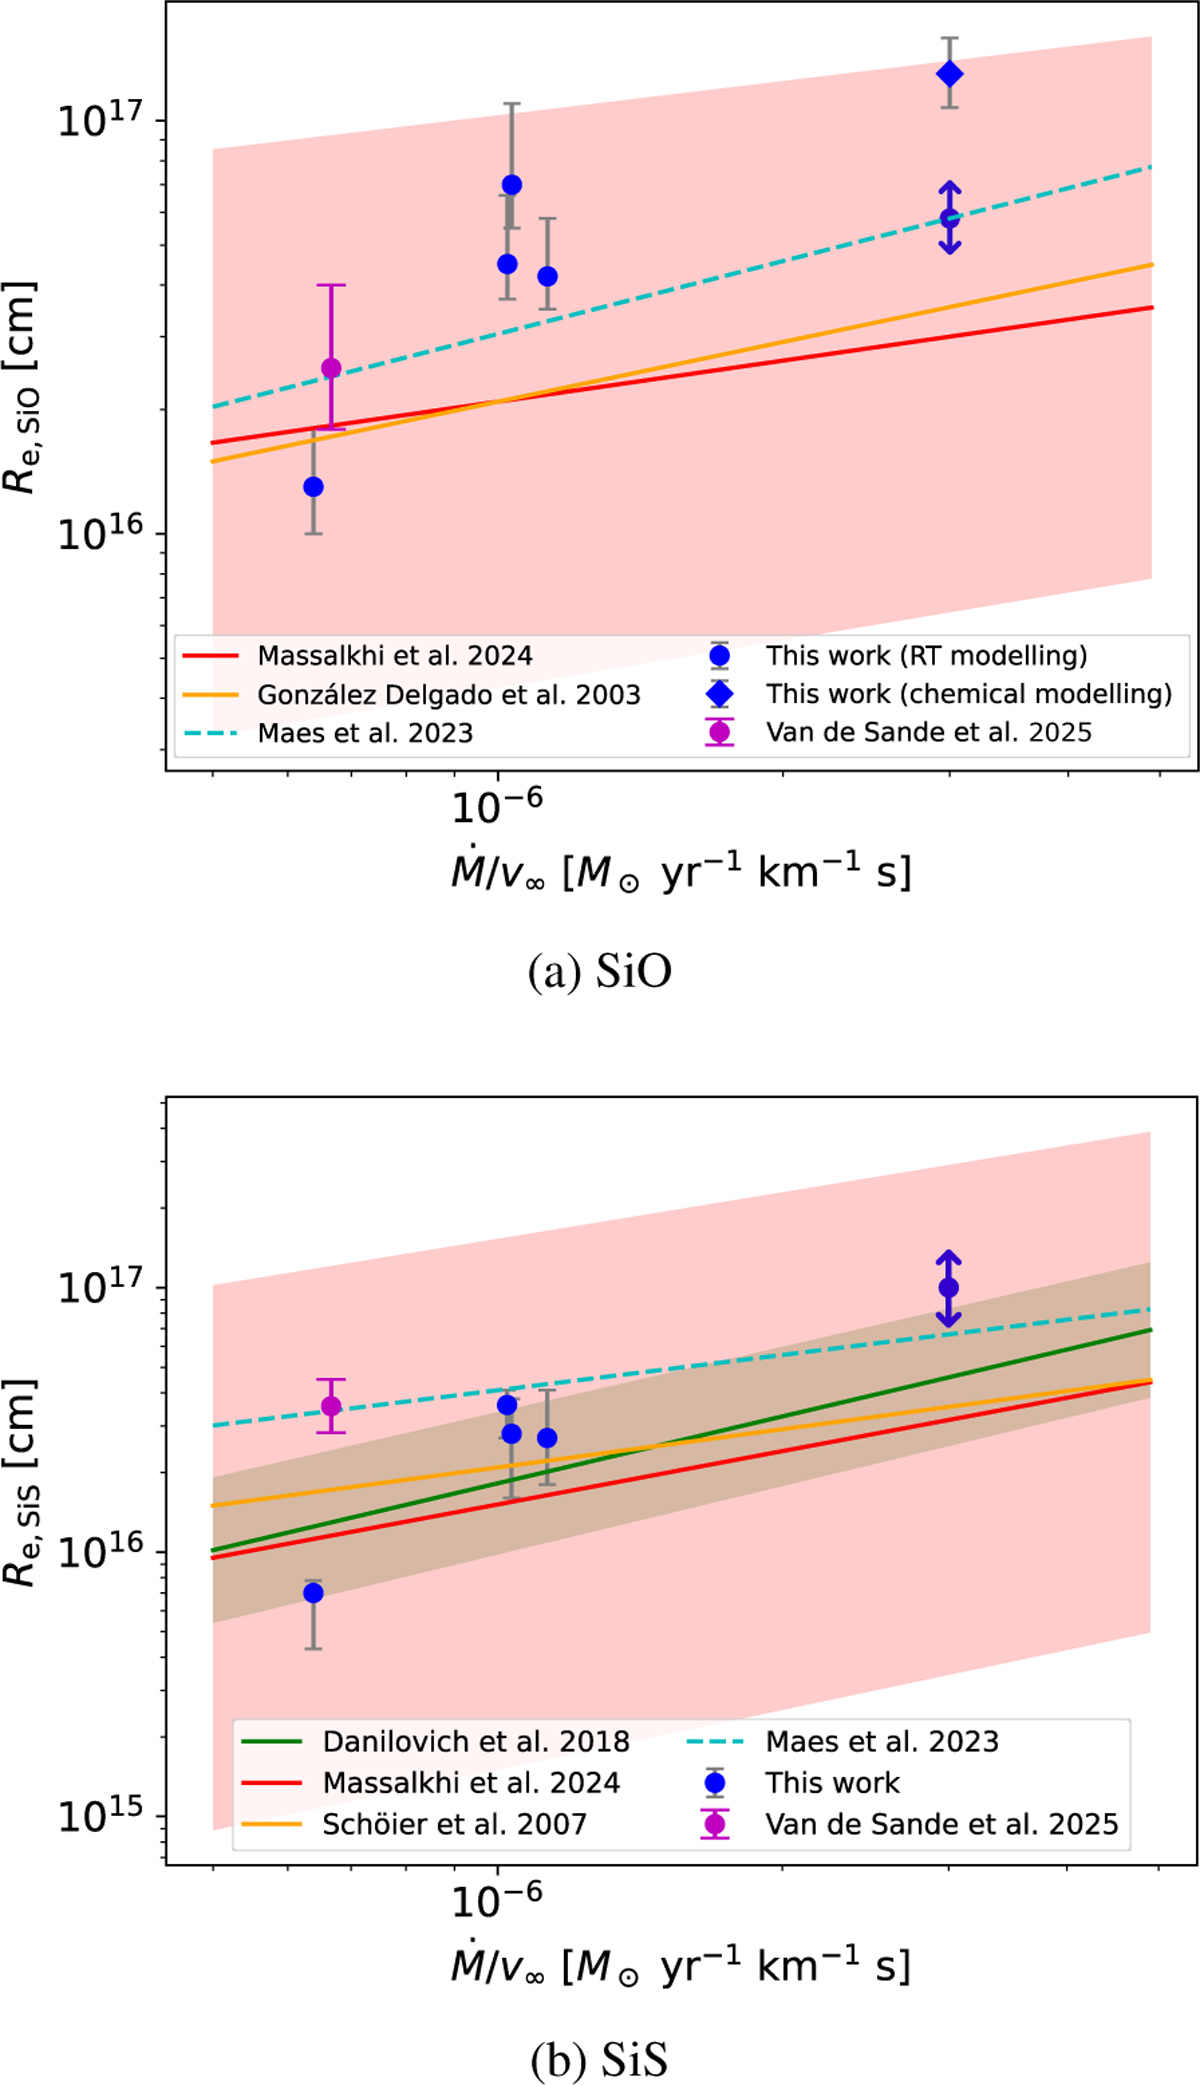
Re of (a) SiO and (b) SiS abundance profiles versus the mass-loss density (ratio of the gas MLR and terminal expansion velocity). The dashed cyan lines are from chemical modelling results (Maes et al. 2023), while the other trends plotted are calculated from RT models. The red and green shaded bands represent the uncertainties on the respective lines. The magenta points are obtained from chemical modelling of a star of MLR 1.0 × 10⁻⁵ M⊙ yr−1, and a v∞ of 15 km s−1, and show the error caused by the uncertainties on the kinetic data (Van de Sande et al. 2025). The rightmost blue circles in both plots are for AFGL 3068, and the open error bars indicate that the Re is not well-constrained for this source. For SiO, the blue diamond indicates the Re predicted by our chemical model (see Sect. 5.6).
Current usage metrics show cumulative count of Article Views (full-text article views including HTML views, PDF and ePub downloads, according to the available data) and Abstracts Views on Vision4Press platform.
Data correspond to usage on the plateform after 2015. The current usage metrics is available 48-96 hours after online publication and is updated daily on week days.
Initial download of the metrics may take a while.