Open Access
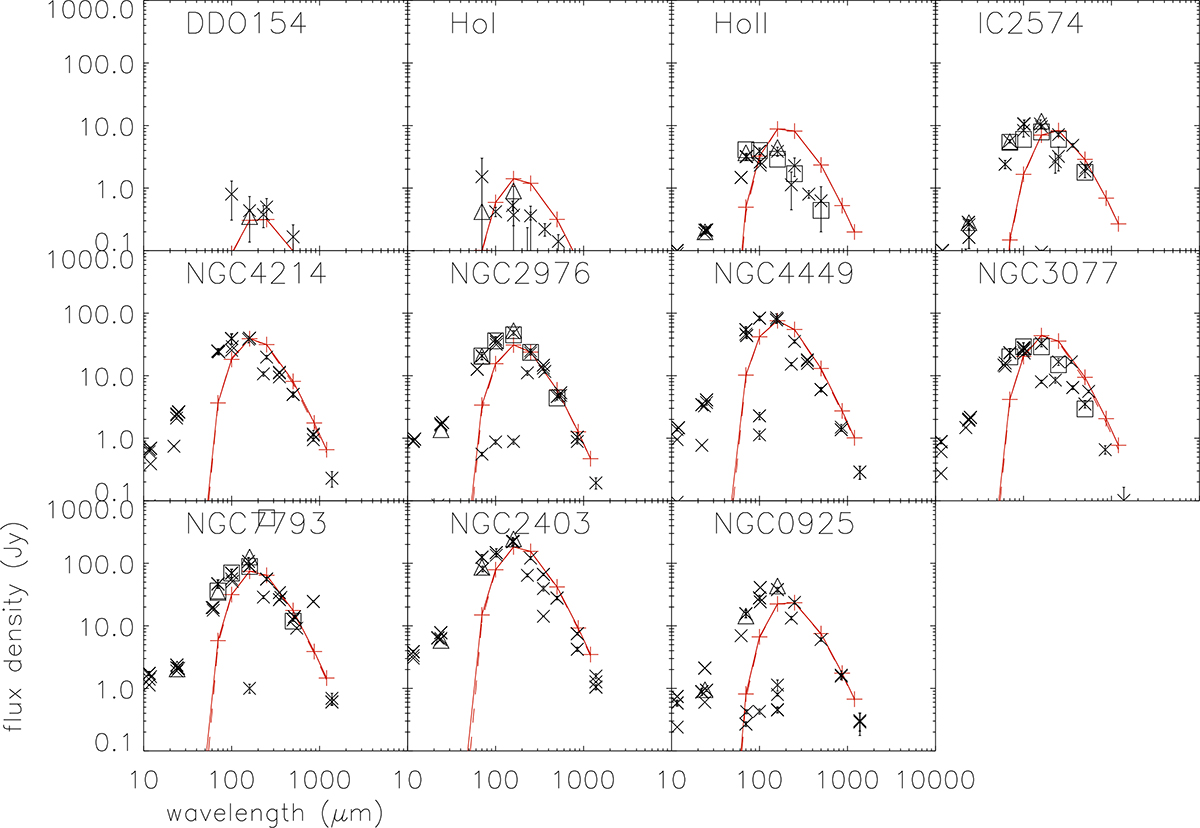
Fig. B.1.
Download original image
IR SEDs. Red pluses and solid line: model SED. Dashed red line shows the modified Planck fit for temperature determination. Black crosses show the VizieR photometry. Black boxes show the Herschel data from Dale et al. (2012). The errors bars are given when available from the VizieR tables, but they are often barely visible.
Current usage metrics show cumulative count of Article Views (full-text article views including HTML views, PDF and ePub downloads, according to the available data) and Abstracts Views on Vision4Press platform.
Data correspond to usage on the plateform after 2015. The current usage metrics is available 48-96 hours after online publication and is updated daily on week days.
Initial download of the metrics may take a while.