Fig. A.8
Download original image
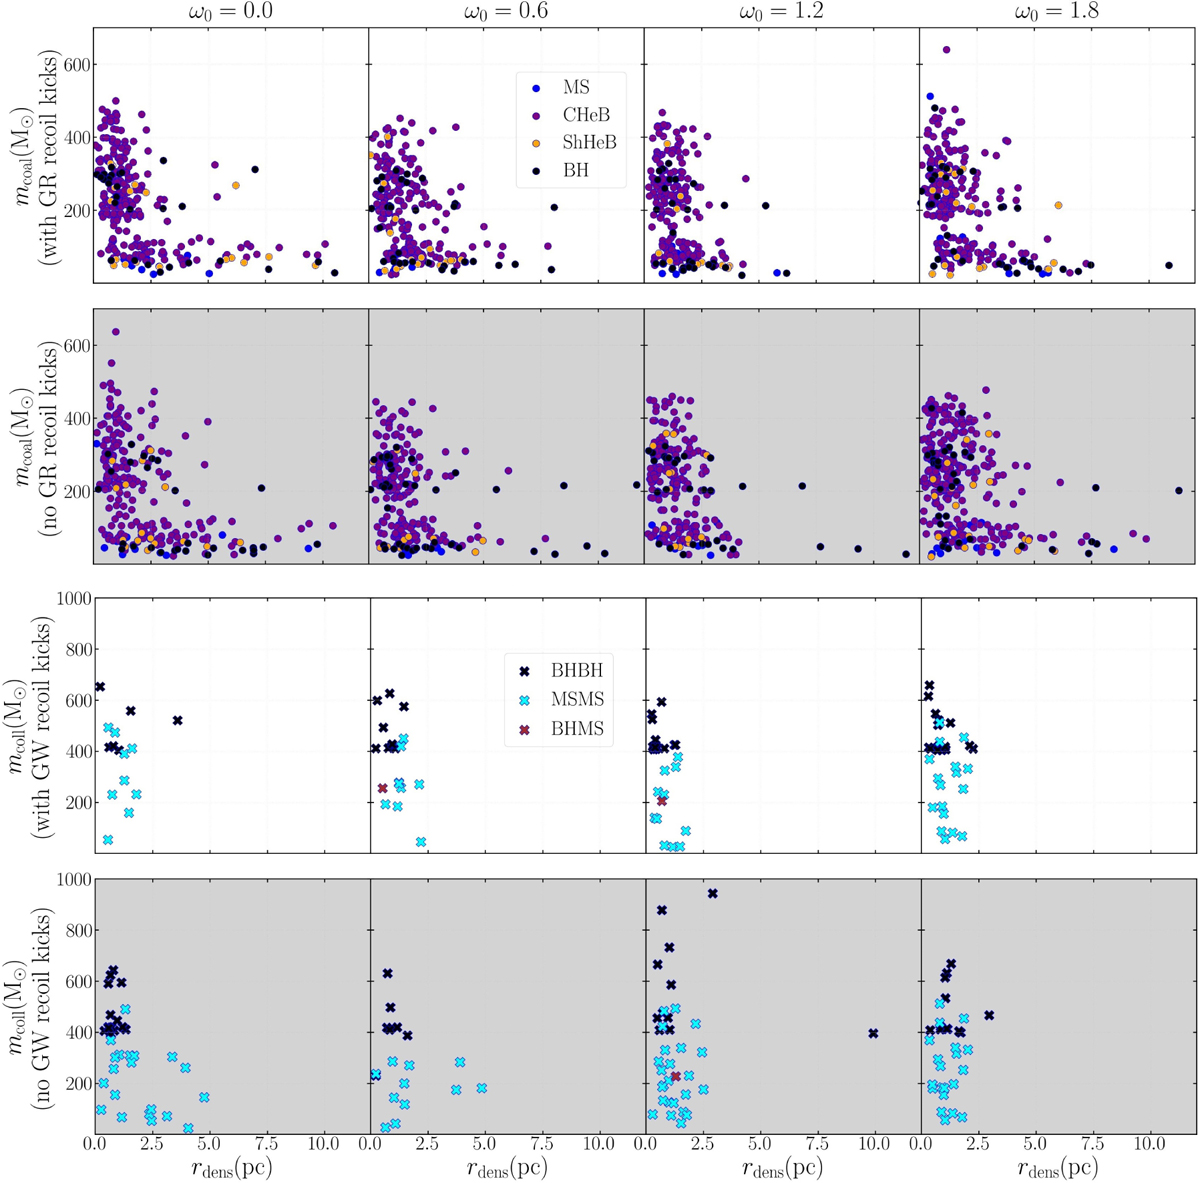
All coalescence (top two rows) and all collision events (bottom two rows) from the eight N-body simulations. Plotted are product masses (mcoal or mcoll) versus distance to the cluster density centre rdens. Columns from left to right show increasing rotation ω0 = 0.0, 0.6, 1.2, 1.8. K models use a white background; NOK models are shaded light grey. Coalescence outcomes: MS (blue), CHeB (purple), ShHeB (orange), BH (black). Collision markers: BH-BH (black cross), MS-MS (cyan cross), BH-MS (violet cross). Counts in Table B.2.
Current usage metrics show cumulative count of Article Views (full-text article views including HTML views, PDF and ePub downloads, according to the available data) and Abstracts Views on Vision4Press platform.
Data correspond to usage on the plateform after 2015. The current usage metrics is available 48-96 hours after online publication and is updated daily on week days.
Initial download of the metrics may take a while.