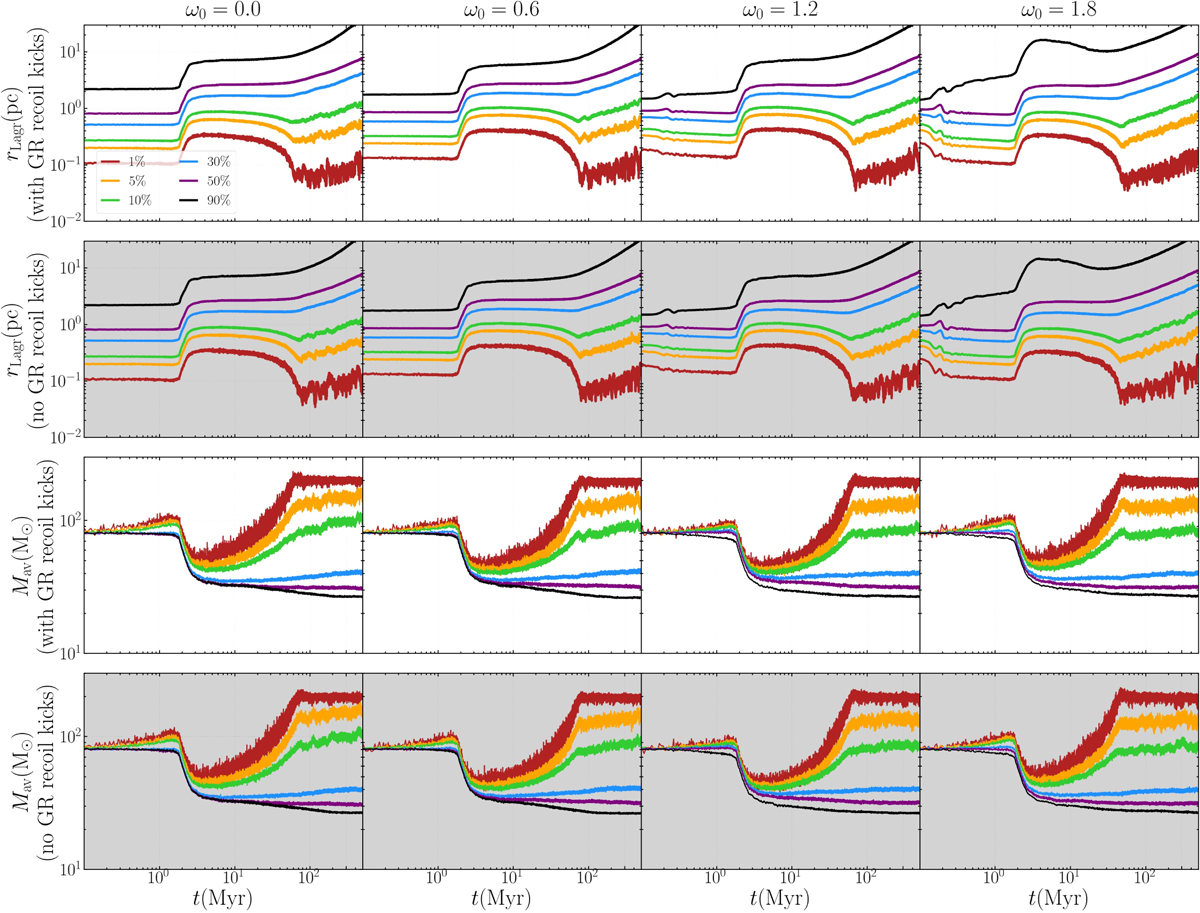
Fig. A.4
Download original image
Lagrange radii (rLagr) and average mass (Mav) within spheres that contain 1%, 5%, 10%, 30%, 50%, and 90% of the total cluster mass at the current simulation time step for up to 500 Myr. Time is shown on a logarithmic scale to highlight the cluster’s rapid early evolution. Each column represents one rotational parameter ω0 of the rotating King model (ω0 = 0.0, 0.6, 1.2, 1.8). Models with K are plotted on a white background; models without GR kicks (NOK) are shaded light grey.
Current usage metrics show cumulative count of Article Views (full-text article views including HTML views, PDF and ePub downloads, according to the available data) and Abstracts Views on Vision4Press platform.
Data correspond to usage on the plateform after 2015. The current usage metrics is available 48-96 hours after online publication and is updated daily on week days.
Initial download of the metrics may take a while.