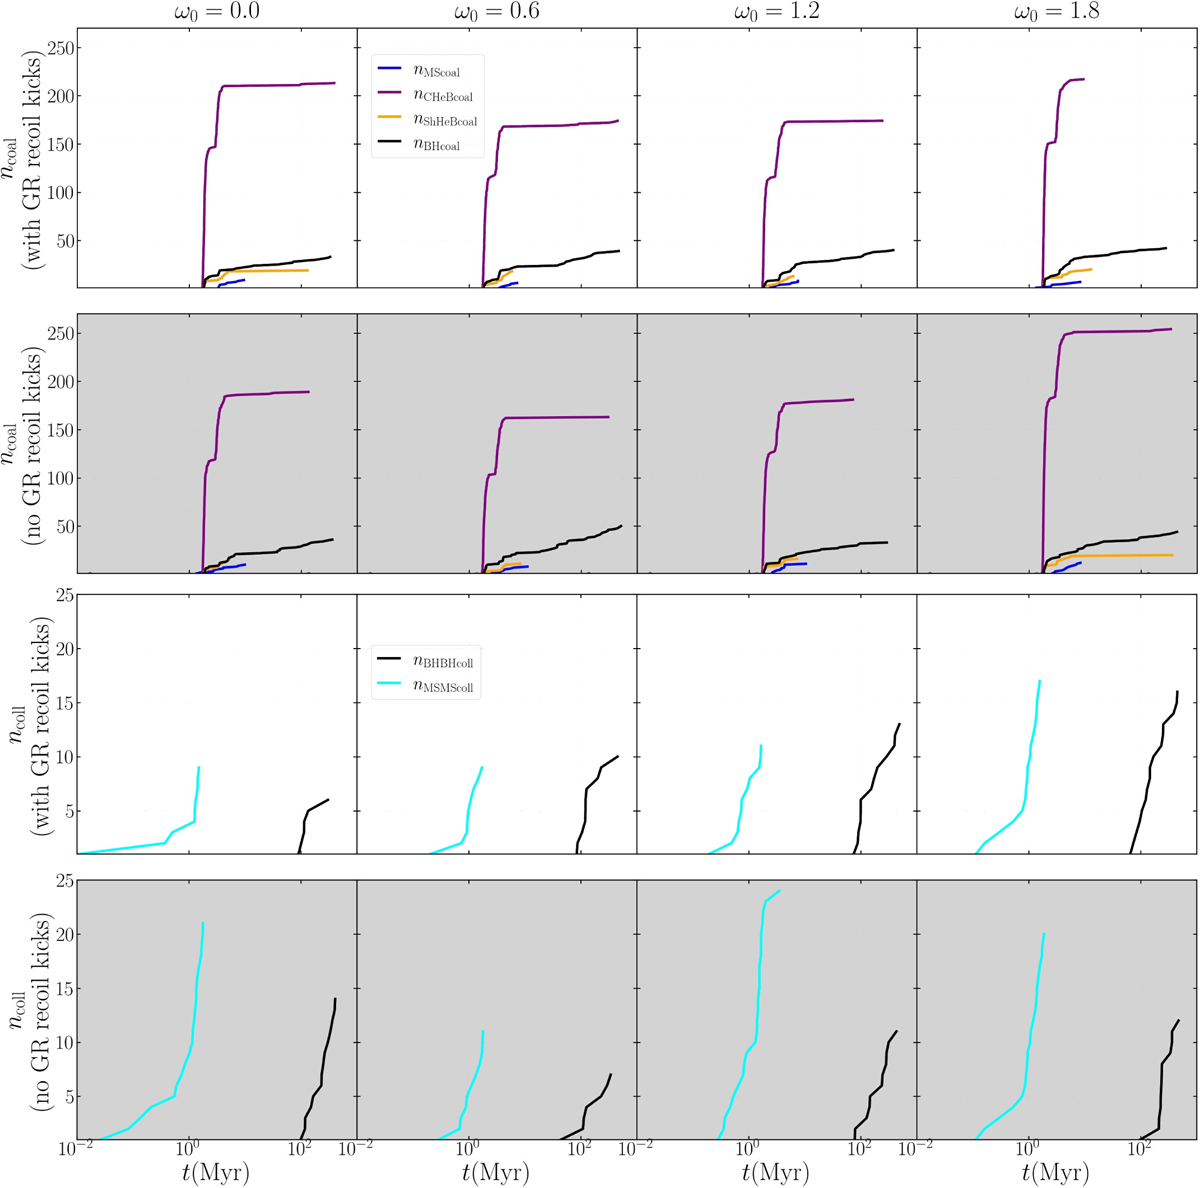
Fig. A.5
Download original image
Time evolution of cumulative number of coalescences ncoal (top two rows) and collisions ncoll (bottom two rows) for the eight runs. Columns give increasing ω0 from left to right. K models (GR kicks on) use a white background; NOK models are shaded light grey. The horizontal axis is logarithmic in time (Myr) to clarify the pre-core-collapse phase. Colours indicate outcomes: MS (blue), CHeB (purple), ShHeB (orange), BH (black); collisions BH-BH (black) and MS-MS (cyan). Counts are in Table B.2
Current usage metrics show cumulative count of Article Views (full-text article views including HTML views, PDF and ePub downloads, according to the available data) and Abstracts Views on Vision4Press platform.
Data correspond to usage on the plateform after 2015. The current usage metrics is available 48-96 hours after online publication and is updated daily on week days.
Initial download of the metrics may take a while.