Fig. 15
Download original image
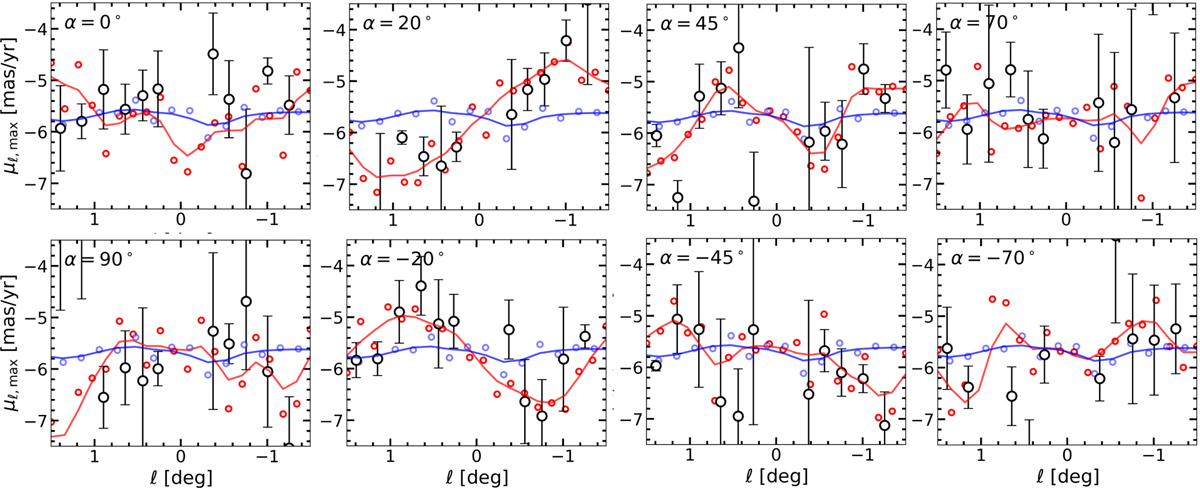
Distribution of μℓ,max versus ℓ distribution for the S-NSB model (red markers and smoothed fit) compared to the axisymmetric NSD (blue). Each panel shows a different nuclear bar angle, α. For small angles |α| ≲ 20°, the NSB produces a ‘step’ feature in the central region (|ℓ| < 1°) that clearly deviates from the flat NSD distribution. This asymmetry weakens substantially as |α| ≳ increases, and becomes indistinguishable from the NSD at α = 0° or ±90°, limiting this diagnostic’s applicability to a narrow range of nuclear bar orientations. Black open circles show measurements from individual midplane fields with N = 1500 stars each from the S-NSB model. Uncertainties are estimated via bootstrap resampling.
Current usage metrics show cumulative count of Article Views (full-text article views including HTML views, PDF and ePub downloads, according to the available data) and Abstracts Views on Vision4Press platform.
Data correspond to usage on the plateform after 2015. The current usage metrics is available 48-96 hours after online publication and is updated daily on week days.
Initial download of the metrics may take a while.