Fig. 16
Download original image
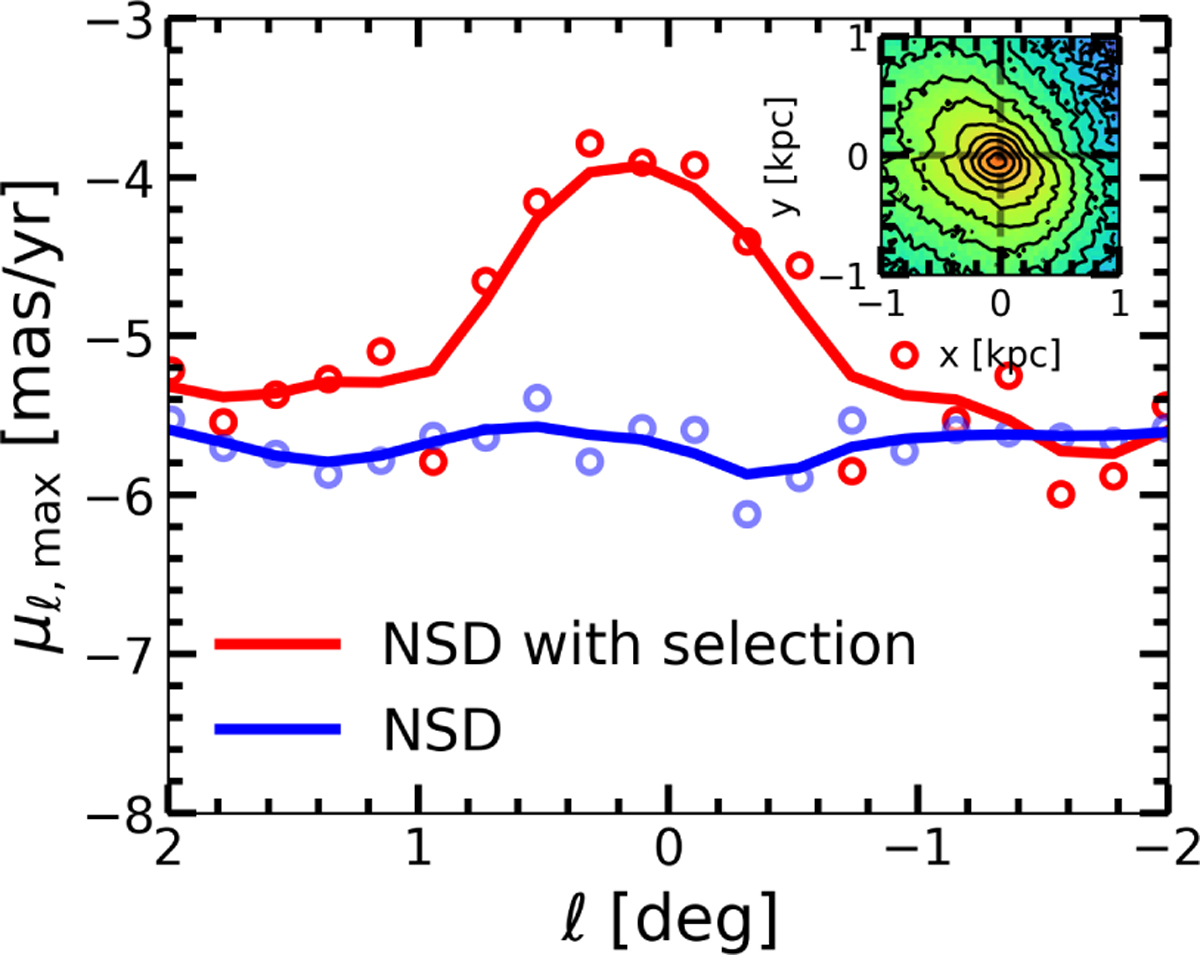
Distribution of μℓ,max versus ℓ for the NSD model without selection effects (blue markers and curve), and with the observational selection function applied (red). The inset shows the resulting face-on density distribution after selection. The distribution is no longer constant, but produces a strong peak in the distribution which could be misinterpreted as evidence of a nuclear bar if observational biases are not carefully accounted for.
Current usage metrics show cumulative count of Article Views (full-text article views including HTML views, PDF and ePub downloads, according to the available data) and Abstracts Views on Vision4Press platform.
Data correspond to usage on the plateform after 2015. The current usage metrics is available 48-96 hours after online publication and is updated daily on week days.
Initial download of the metrics may take a while.