Fig. 3
Download original image
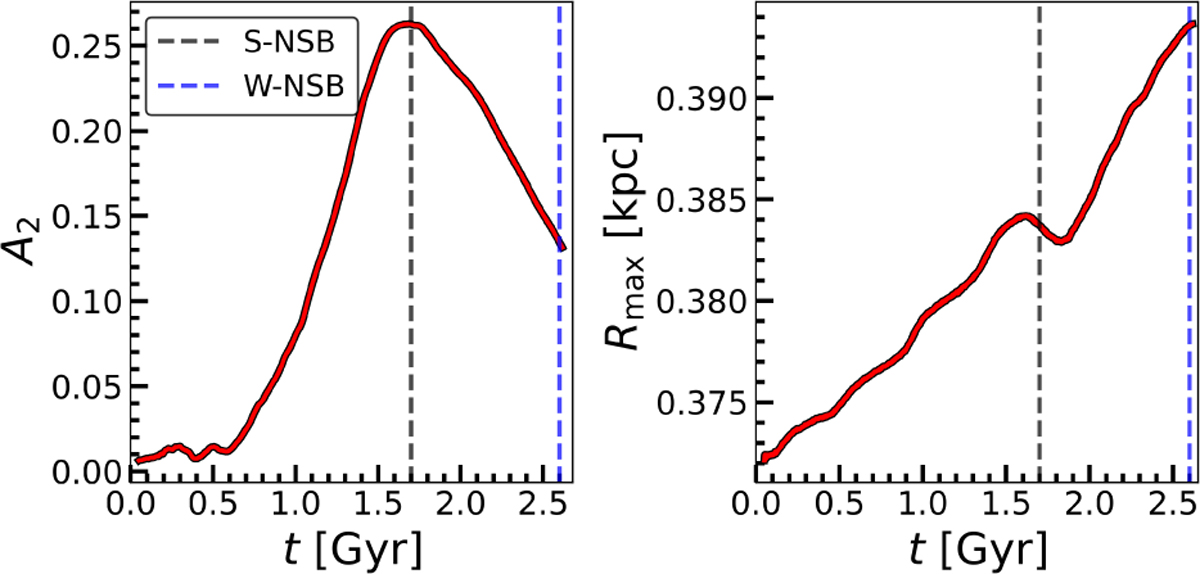
Evolution of the NSD model. Left: bar strength, measured by the Fourier A2 parameter, as a function of time. The parameter A2 was calculated considering all stars within the radius Rmax that encloses 98% of the model’s mass. Right: evolution of Rmax with time. The initially stable NSD starts forming a bar at t ≈ 0.5 Gyr, which reaches maximum strength at t ≈ 1.7 Gyr. Black and blue dashed lines indicate the times at which the S-NSB and W-NSB models are extracted, respectively.
Current usage metrics show cumulative count of Article Views (full-text article views including HTML views, PDF and ePub downloads, according to the available data) and Abstracts Views on Vision4Press platform.
Data correspond to usage on the plateform after 2015. The current usage metrics is available 48-96 hours after online publication and is updated daily on week days.
Initial download of the metrics may take a while.