Fig. 5
Download original image
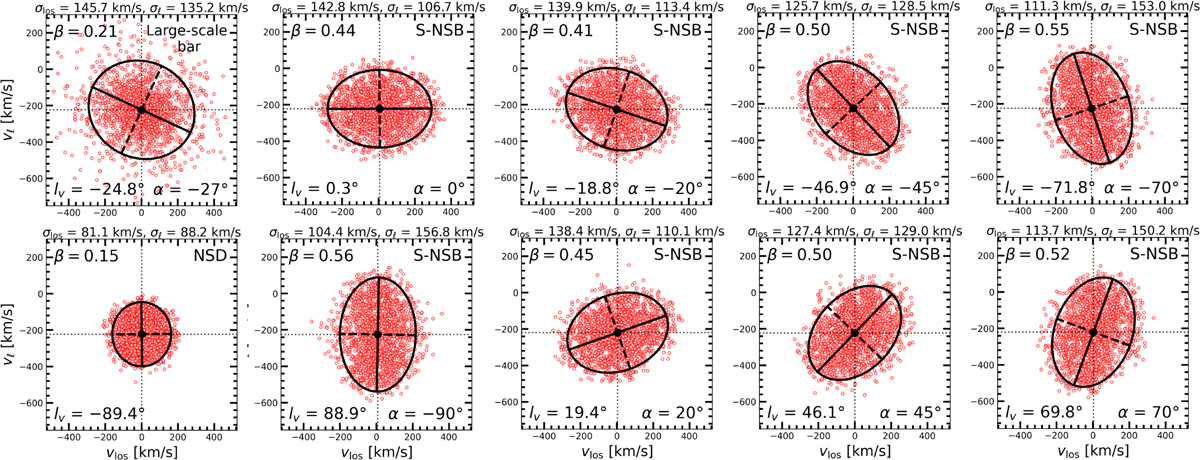
Velocity ellipses for the models, with the major and minor axes shown in solid and dashed lines, respectively. We uniformly sampled N = 2400 stars from the region |ℓ| < 0.9° and |b| < 0.25°. In each panel we denote the vertex deviation (lv), the anisotropy (β), the bar angle α (except for the NSD case), and the velocity dispersions in the line of sight and longitude directions. The top-left panel shows the ellipse for the large-scale MW model with no nuclear component. As expected, the direction of highest dispersion is in the line of sight direction. The bottom left shows the ellipse for the axisymmetric NSD model. The other panels show the ellipses for the S-NSB model with various nuclear bar angles. In this case, the direction of highest dispersion depends on the nuclear bar angle.
Current usage metrics show cumulative count of Article Views (full-text article views including HTML views, PDF and ePub downloads, according to the available data) and Abstracts Views on Vision4Press platform.
Data correspond to usage on the plateform after 2015. The current usage metrics is available 48-96 hours after online publication and is updated daily on week days.
Initial download of the metrics may take a while.