Fig. 6
Download original image
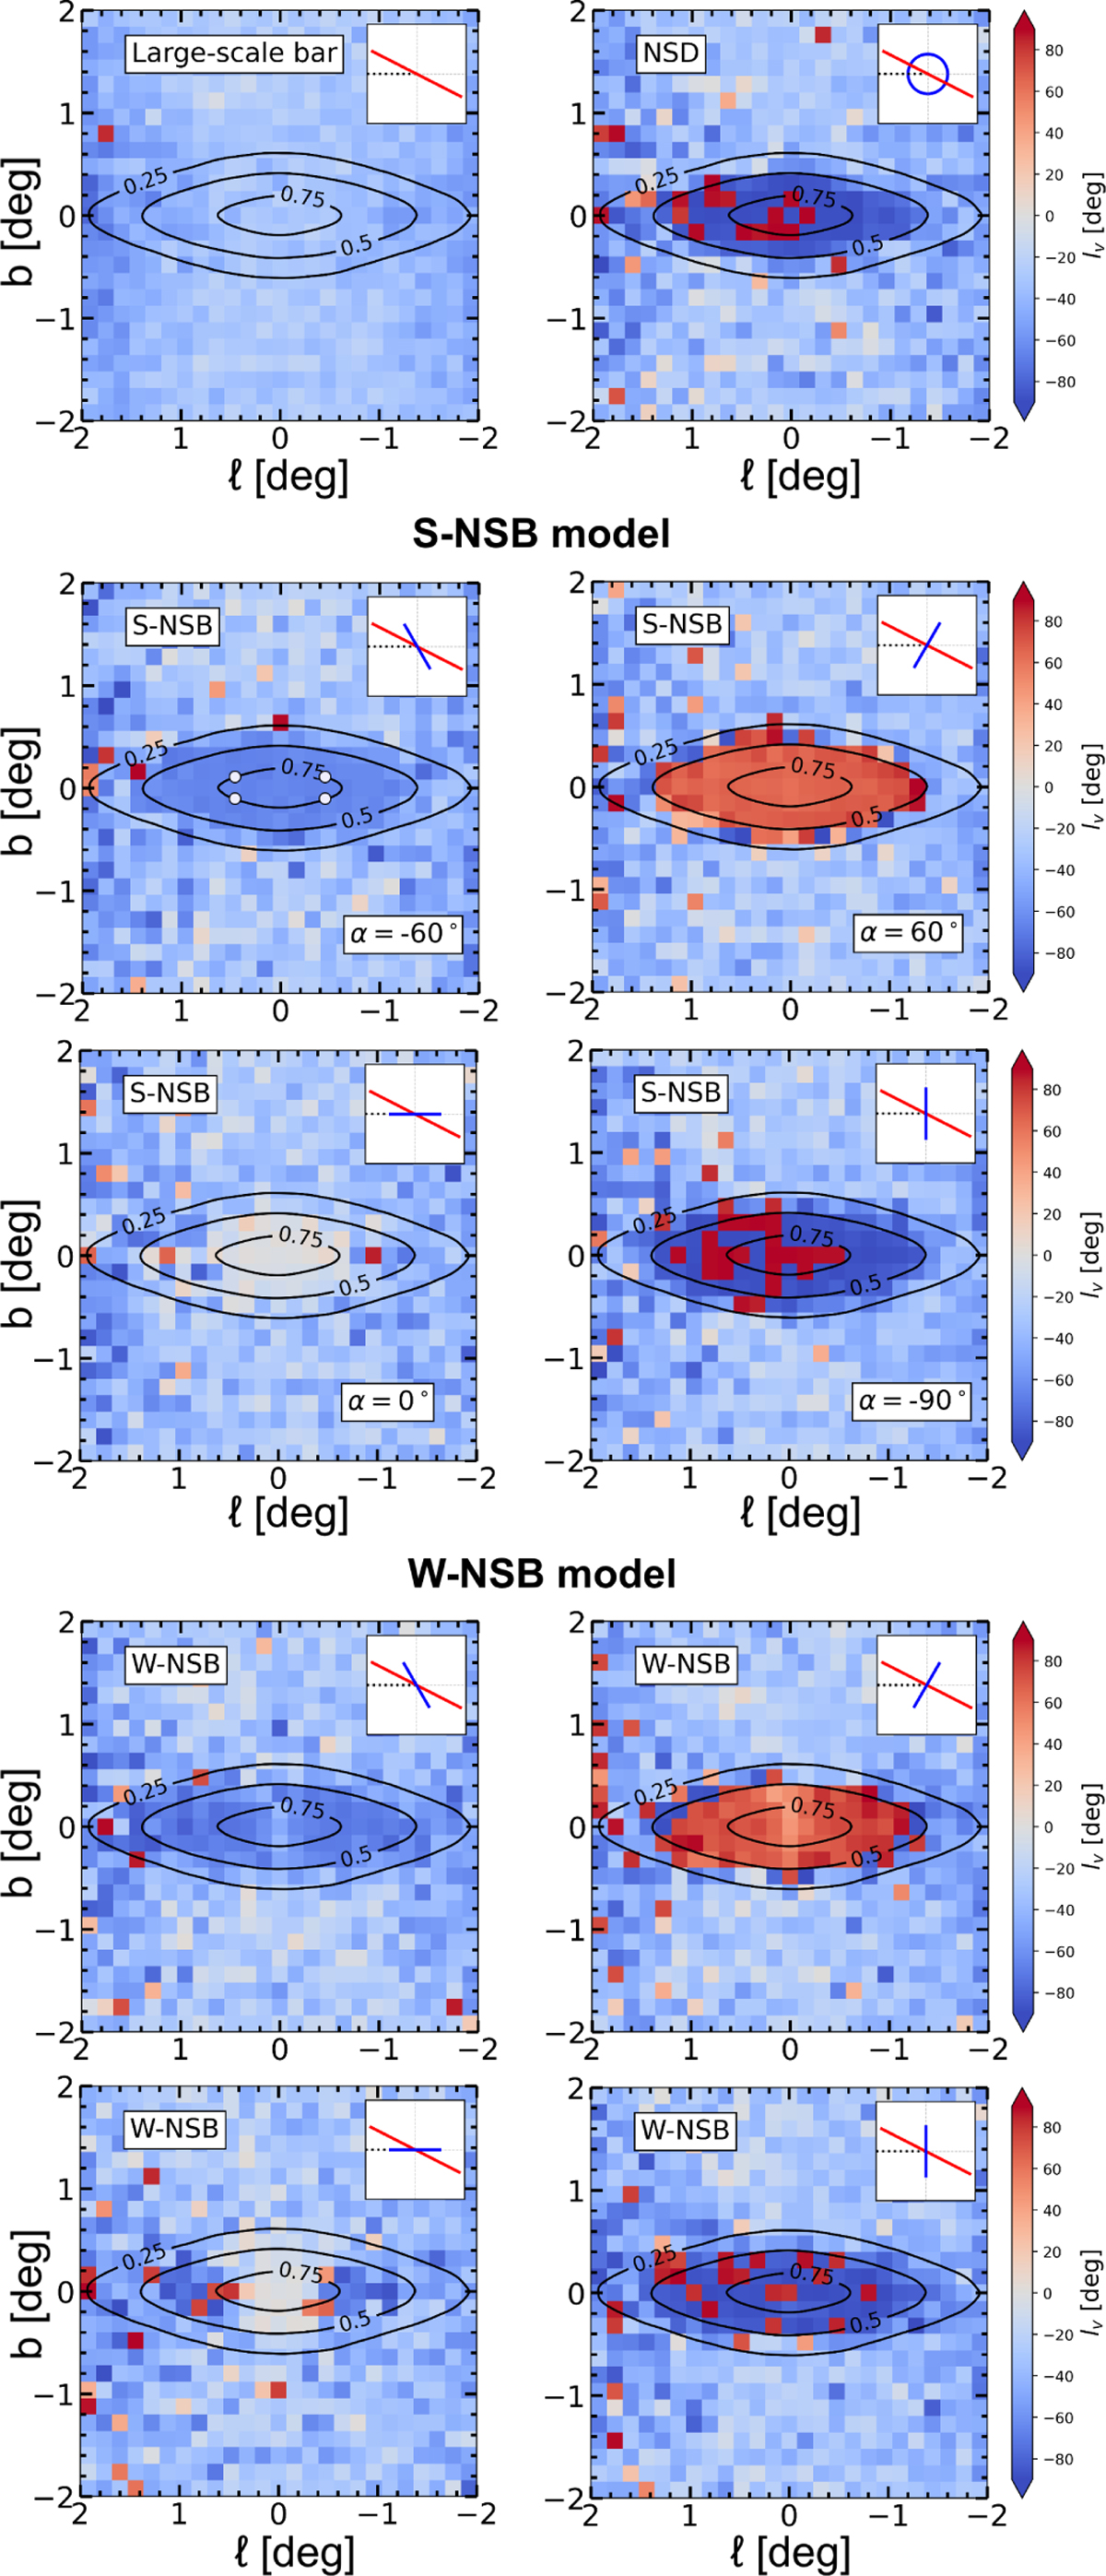
Two-dimensional maps in (ℓ, b) space coloured by the vertex deviation, lv. Top row: maps for the large-scale Milky Way model without a nuclear component (left) and with an axisymmetric NSD model (right). The NSD is indicated by the blue circle in the inset. Middle panels: maps for the S-NSB model with the nuclear bar at various orientations, α. Insets show the geometric configuration of the outer bar (red line) and nuclear bar (blue line). White markers in the top-left panel indicate the fields used in the analysis of Sect. 3.3. Bottom panels: same as above but for the W-NSB model.
Current usage metrics show cumulative count of Article Views (full-text article views including HTML views, PDF and ePub downloads, according to the available data) and Abstracts Views on Vision4Press platform.
Data correspond to usage on the plateform after 2015. The current usage metrics is available 48-96 hours after online publication and is updated daily on week days.
Initial download of the metrics may take a while.