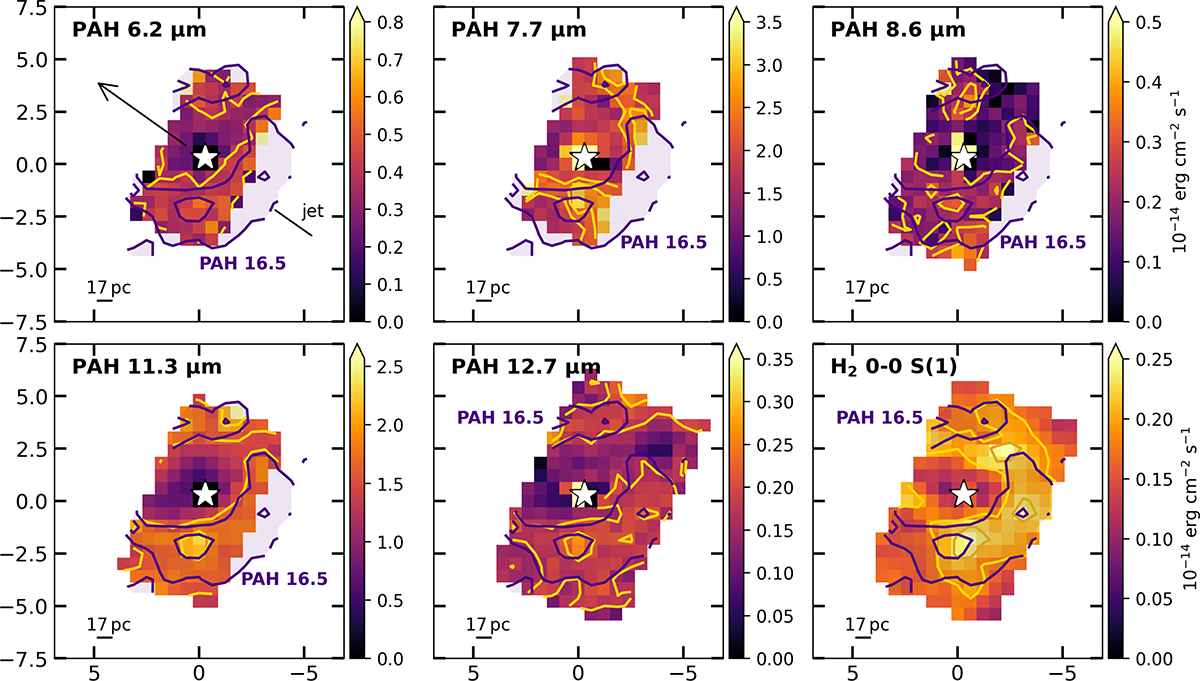
Fig. A.1.
Download original image
From top left to bottom right: mom0 maps of the most prominent PAH features (at 6.2, 7.7, 8.6, 11.3, and 12.7 μm) and the H2 0-0 S(1) 17.03 μm line. We obtained the mom0 maps after subtraction of the local continuum, from the MIRI-MRS cube re-binned to spaxel scale of 0.6″ (Sect. 3.1). Yellow contours trace the feature emission at levels of: [0.4, 0.55]×10−14 erg cm−2 s−1 (PAH 6.2); [2, 2.75]×10−14 erg cm−2 s−1 (PAH 7.7); [0.18, 0.27]×10−14 erg cm−2 s−1 (PAH 8.6); [1.5, 2]×10−14 erg cm−2 s−1 (PAH 11.3); [0.17, 0.22]×10−14 erg cm−2 s−1 (PAH 12.7); [0.19, 0.23]×10−14 erg cm−2 s−1 (H2 0-0 S(1)). Violet contours show the PAH 16.5 μm emission at [0.18, 0.225]×10−14 erg cm−2 s−1. In the top-left panel, the black arrow indicates the position angle of the jet (i.e. PAjet = 51 deg). The stars correspond to the position of the AGN. North is up, and east is to the left.
Current usage metrics show cumulative count of Article Views (full-text article views including HTML views, PDF and ePub downloads, according to the available data) and Abstracts Views on Vision4Press platform.
Data correspond to usage on the plateform after 2015. The current usage metrics is available 48-96 hours after online publication and is updated daily on week days.
Initial download of the metrics may take a while.