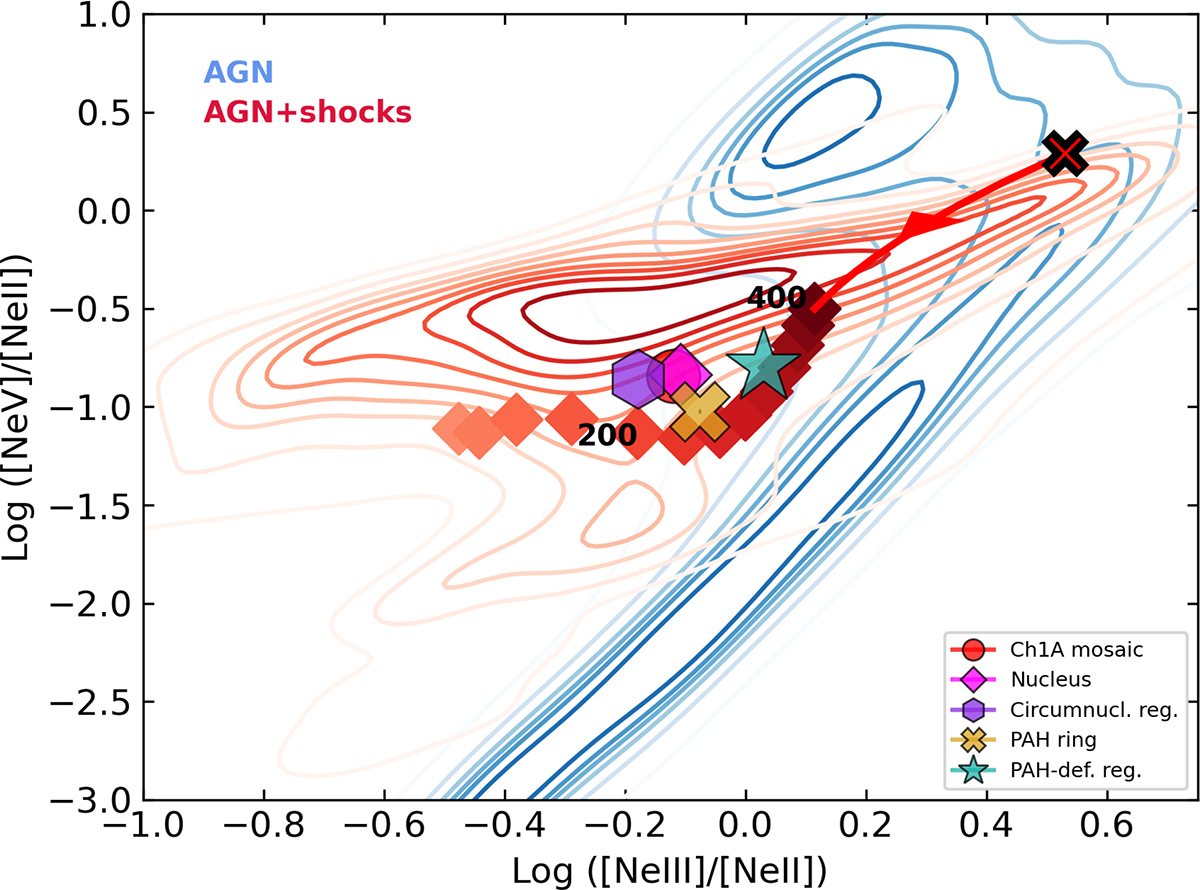
Fig. F.1.
Download original image
Neon line-ratio diagnostic diagram, showing [Ne V]14 / [Ne II]12 versus [Ne III]15 / [Ne II]12 for the five regions analysed: full Ch 1A mosaic (red circle), nucleus (magenta diamond), circumnuclear region (violet hexagon), PAH ring (yellow cross), and PAH-deficient region (green star). Blue density contours indicate the pure AGN models of Feltre et al. (2016), while red contours show the AGN+shock models of Feltre et al. (2023). The red arrow illustrates the effect of adding a 0 − 90% shock contribution to Hβ to an AGN model with Z = 0.017, log(⟨U⟩) = −2.5, nH = 103 cm−3, ξd = 0.3, and α = −1.7 (black cross; Feltre et al. 2016). Orange diamonds mark AGN+shock models with a 90% shock contribution, with shock velocities increasing from 100 to 400 km s−1 (light to dark).
Current usage metrics show cumulative count of Article Views (full-text article views including HTML views, PDF and ePub downloads, according to the available data) and Abstracts Views on Vision4Press platform.
Data correspond to usage on the plateform after 2015. The current usage metrics is available 48-96 hours after online publication and is updated daily on week days.
Initial download of the metrics may take a while.