Fig. 3.
Download original image
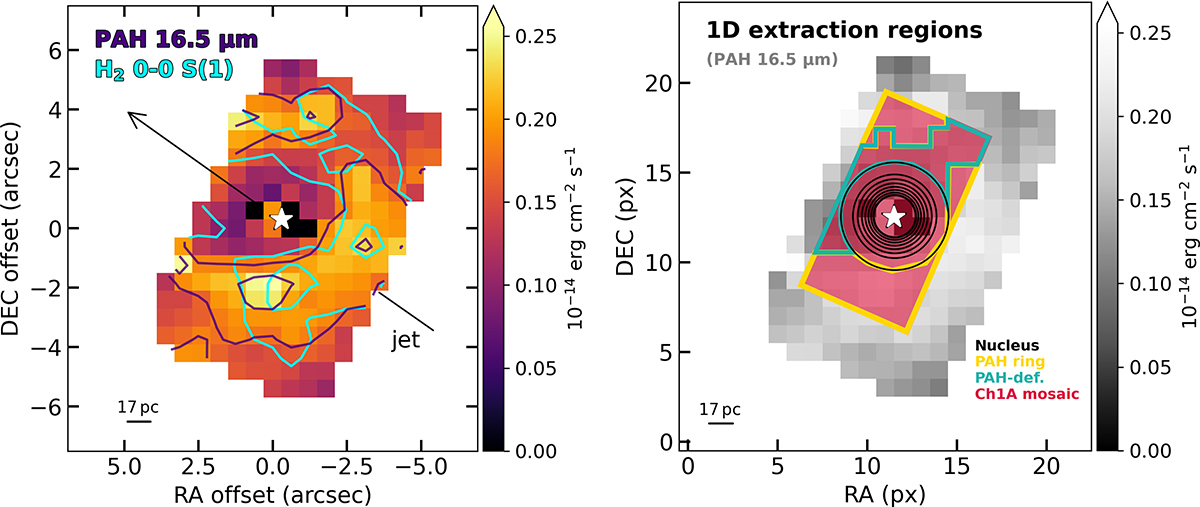
Left: Mom0 map of the PAH 16.5 μm feature in the nuclear region of Cen A at 0.65″ resolution (∼11 pc), obtained after subtraction of the local continuum. Violet contours show the PAH emission at levels of (0.2, 0.25)×10−14 erg cm−2 s−1. Cyan contours trace the H2 0-0 S(1) 17.03 μm rotational line at levels of (0.19, 0.23)×10−14 erg cm−2 s−1. The black arrows indicate the position angle of the jet (i.e. PAjet = 51 deg). Bright pixels near the AGN position are artefacts resulting from the local continuum subtraction. Right: 1D extraction regions defined within the Ch 1A mosaic (red filled area), overlaid on the PAH 16.5 μm surface density map (grey scale): nucleus (concentric circular areas in black), PAH ring (yellow), PAH-deficient region (green). The circumnuclear region is defined as the full Ch 1A mosaic minus the nuclear emission. In both panels, the star marks the peak of the continuum, corresponding to the position of the AGN. The [0,0] point on the axes (pixel [11,12]) denotes the centre of the sub-channel array (Ch 3C). North is up and east is to the left.
Current usage metrics show cumulative count of Article Views (full-text article views including HTML views, PDF and ePub downloads, according to the available data) and Abstracts Views on Vision4Press platform.
Data correspond to usage on the plateform after 2015. The current usage metrics is available 48-96 hours after online publication and is updated daily on week days.
Initial download of the metrics may take a while.