Fig. 4.
Download original image
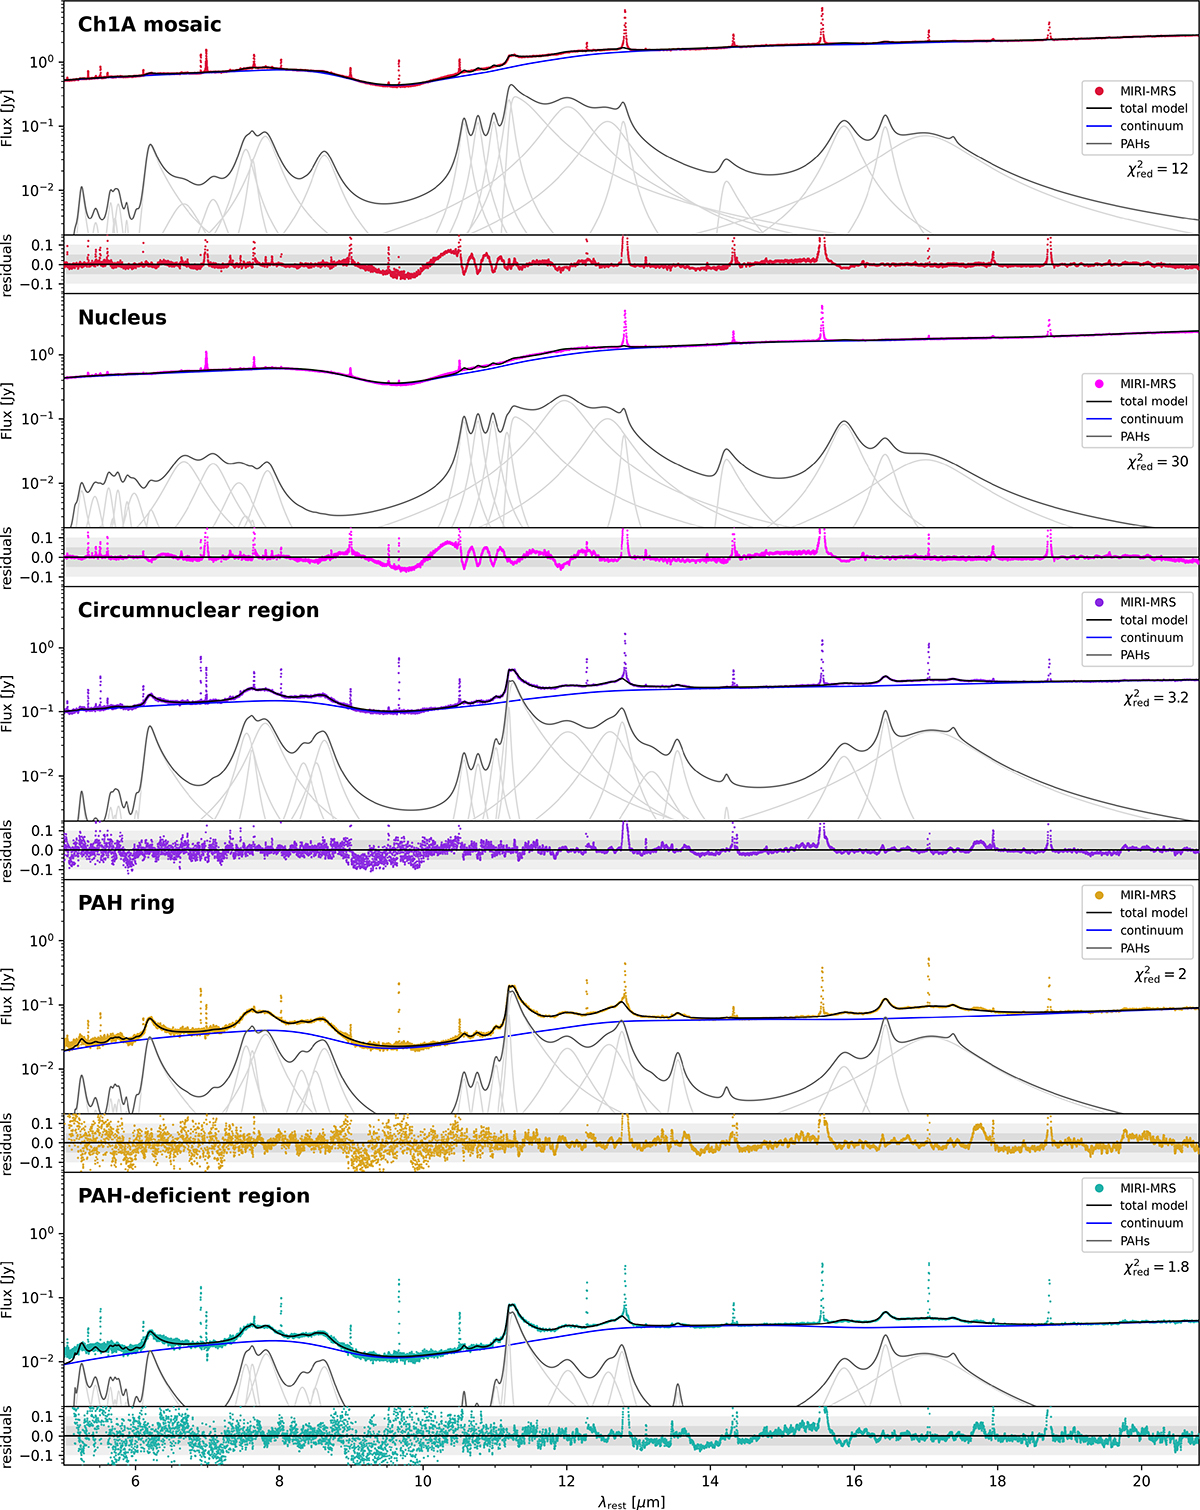
MIRI-MRS spectra extracted from five regions (top to bottom): full Ch 1A mosaic (red), nucleus (magenta), circumnuclear region (violet), PAH ring (yellow), and PAH-deficient region (green). Extraction regions are shown in the right panel of Fig. 3. Black lines indicate the total best-fit models from the MIR decomposition tool (Donnan et al. 2024); blue and grey lines show the fitted continua (stellar + AGN) and PAH components, respectively. Fit residuals are displayed below each panel; the reduced χ2 is reported below the legend.
Current usage metrics show cumulative count of Article Views (full-text article views including HTML views, PDF and ePub downloads, according to the available data) and Abstracts Views on Vision4Press platform.
Data correspond to usage on the plateform after 2015. The current usage metrics is available 48-96 hours after online publication and is updated daily on week days.
Initial download of the metrics may take a while.