Open Access
Fig. 8.
Download original image
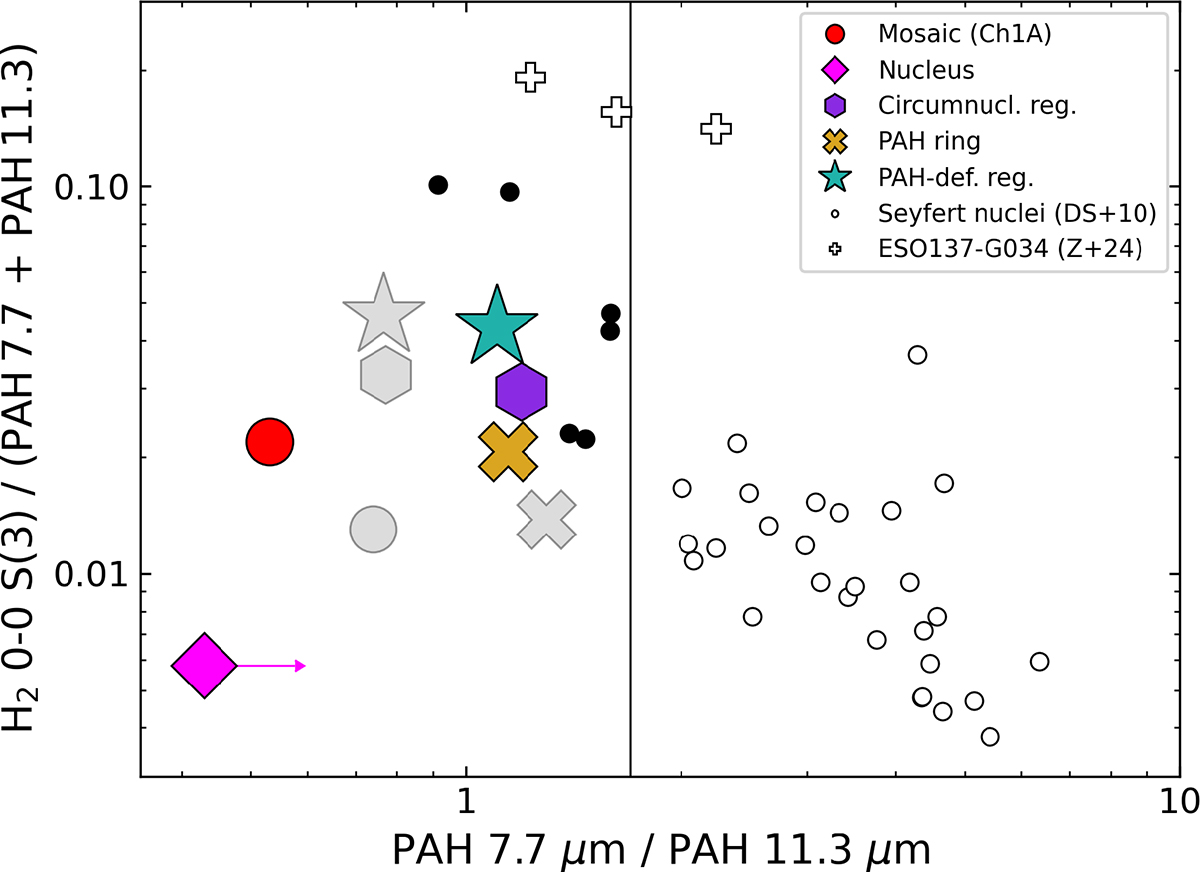
H2 0-0 S(3) intensity relative to 7.7 and 11.3 μm PAH bands diagnostic plot, quantifying shock-driven collisional excitation of H2. Symbols are as in Fig. 5. Uncertainties, between 10 − 50%, are omitted for clarity. The nuclear lower limit results from partial detection of the 7.7 μm feature (Appendix C).
Current usage metrics show cumulative count of Article Views (full-text article views including HTML views, PDF and ePub downloads, according to the available data) and Abstracts Views on Vision4Press platform.
Data correspond to usage on the plateform after 2015. The current usage metrics is available 48-96 hours after online publication and is updated daily on week days.
Initial download of the metrics may take a while.