Fig. 2
Download original image
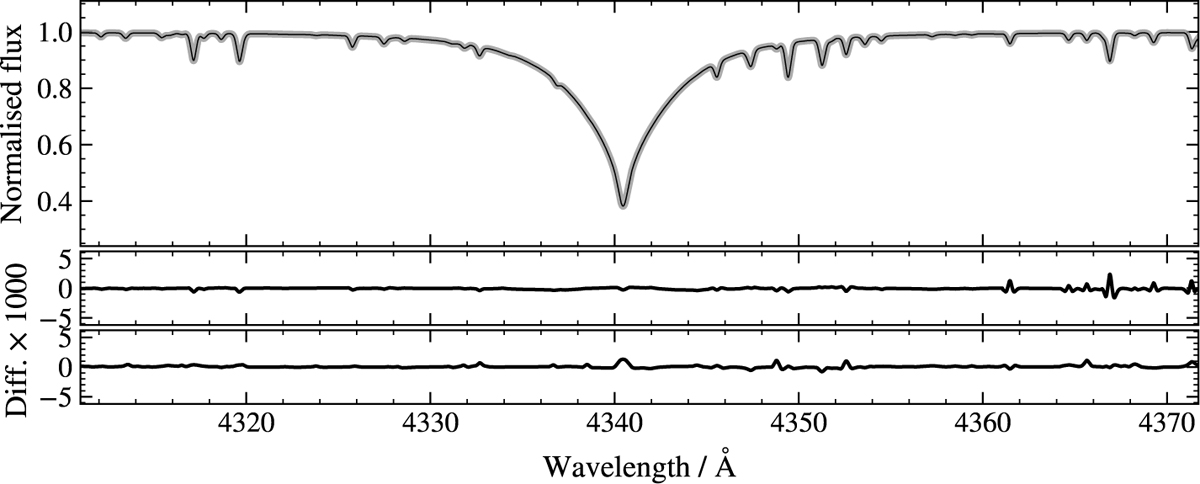
Comparison between a model spectrum calculated with ADS and the spectra created with the neural networks. Top panel: the normalised spectrum of an ADS model with Teff = 18 500 K and log(g) = 3.10 (grey line) is compared to the spectrum created with the neural network from the B1 region with the same parameters (black line). Middle panel: difference between the two spectra. Bottom panel: difference between the ADS model spectrum and the spectrum created with the neural network from the B2 region.
Current usage metrics show cumulative count of Article Views (full-text article views including HTML views, PDF and ePub downloads, according to the available data) and Abstracts Views on Vision4Press platform.
Data correspond to usage on the plateform after 2015. The current usage metrics is available 48-96 hours after online publication and is updated daily on week days.
Initial download of the metrics may take a while.