Fig. 3
Download original image
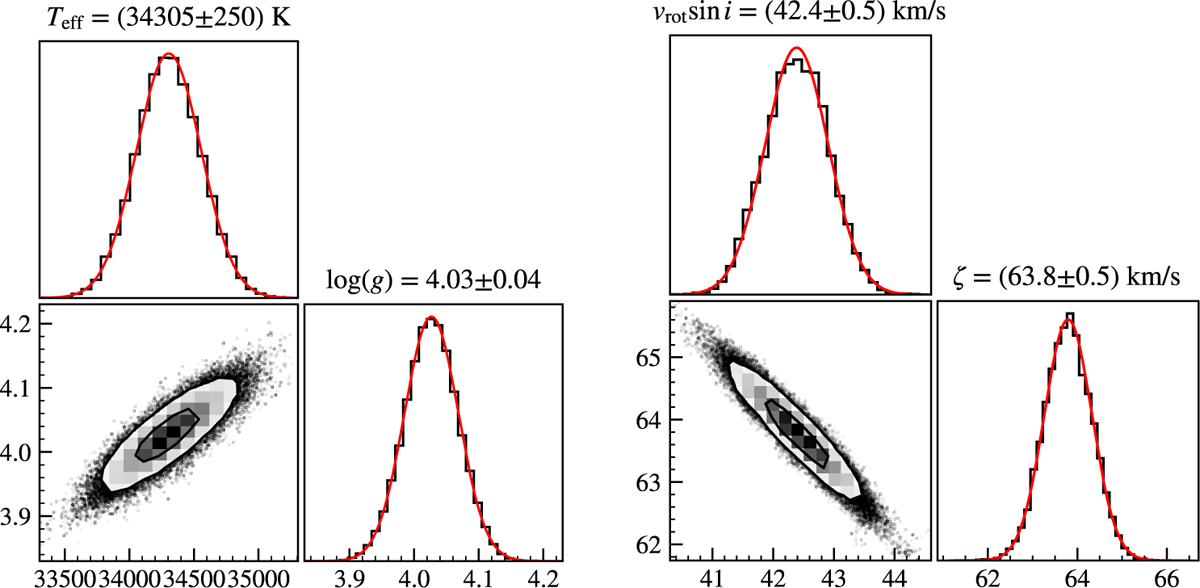
Exemplary corner plots of the MCMC fit results. In each example the bottom left shows the 2D histogram with 1σ and 2σ contours. The two adjacent plots show 1D histograms for the parameters (black) and a Gaussian (red) with same mean and standard deviation. Left panel set: Teff and log(g) determination for the benchmark test star HD 214680. Right panel set: v sin i and ζ determination for HD 91316.
Current usage metrics show cumulative count of Article Views (full-text article views including HTML views, PDF and ePub downloads, according to the available data) and Abstracts Views on Vision4Press platform.
Data correspond to usage on the plateform after 2015. The current usage metrics is available 48-96 hours after online publication and is updated daily on week days.
Initial download of the metrics may take a while.