Open Access
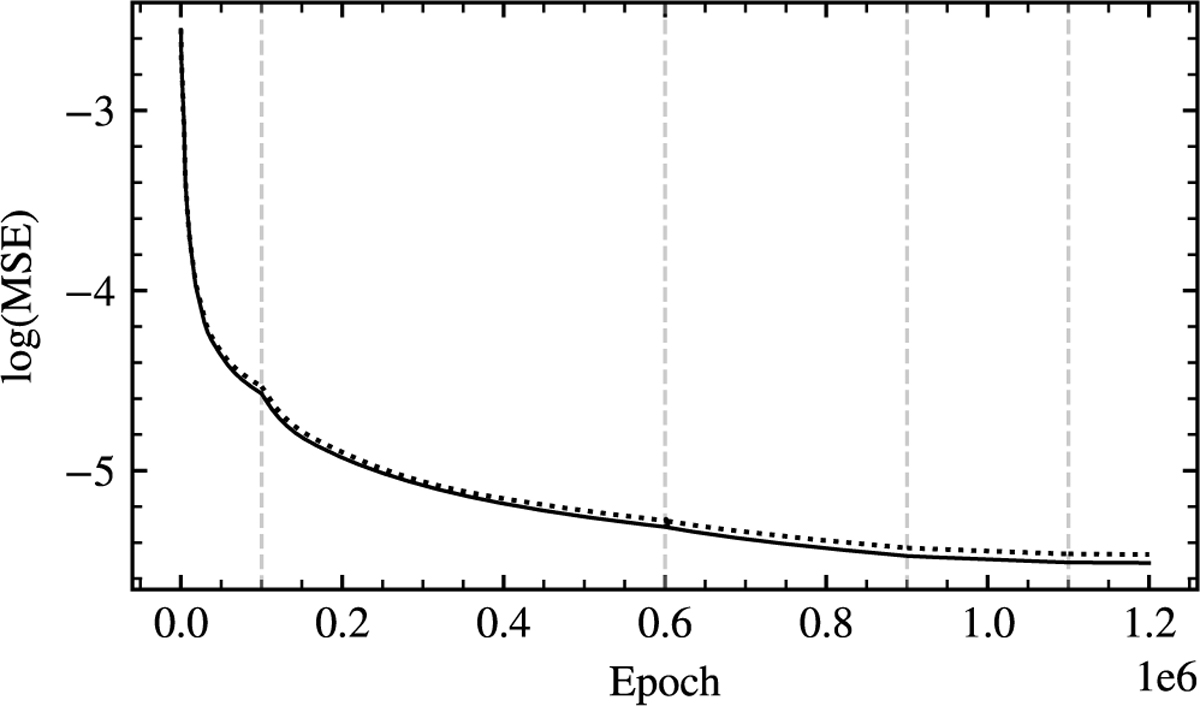
Fig. A.1
Download original image
Mean squared error as a function of training epoch. The solid line is the MSE for the training data and the dotted line for the test data. The dashed vertical lines mark the epochs where the learning rate was reduced.
Current usage metrics show cumulative count of Article Views (full-text article views including HTML views, PDF and ePub downloads, according to the available data) and Abstracts Views on Vision4Press platform.
Data correspond to usage on the plateform after 2015. The current usage metrics is available 48-96 hours after online publication and is updated daily on week days.
Initial download of the metrics may take a while.