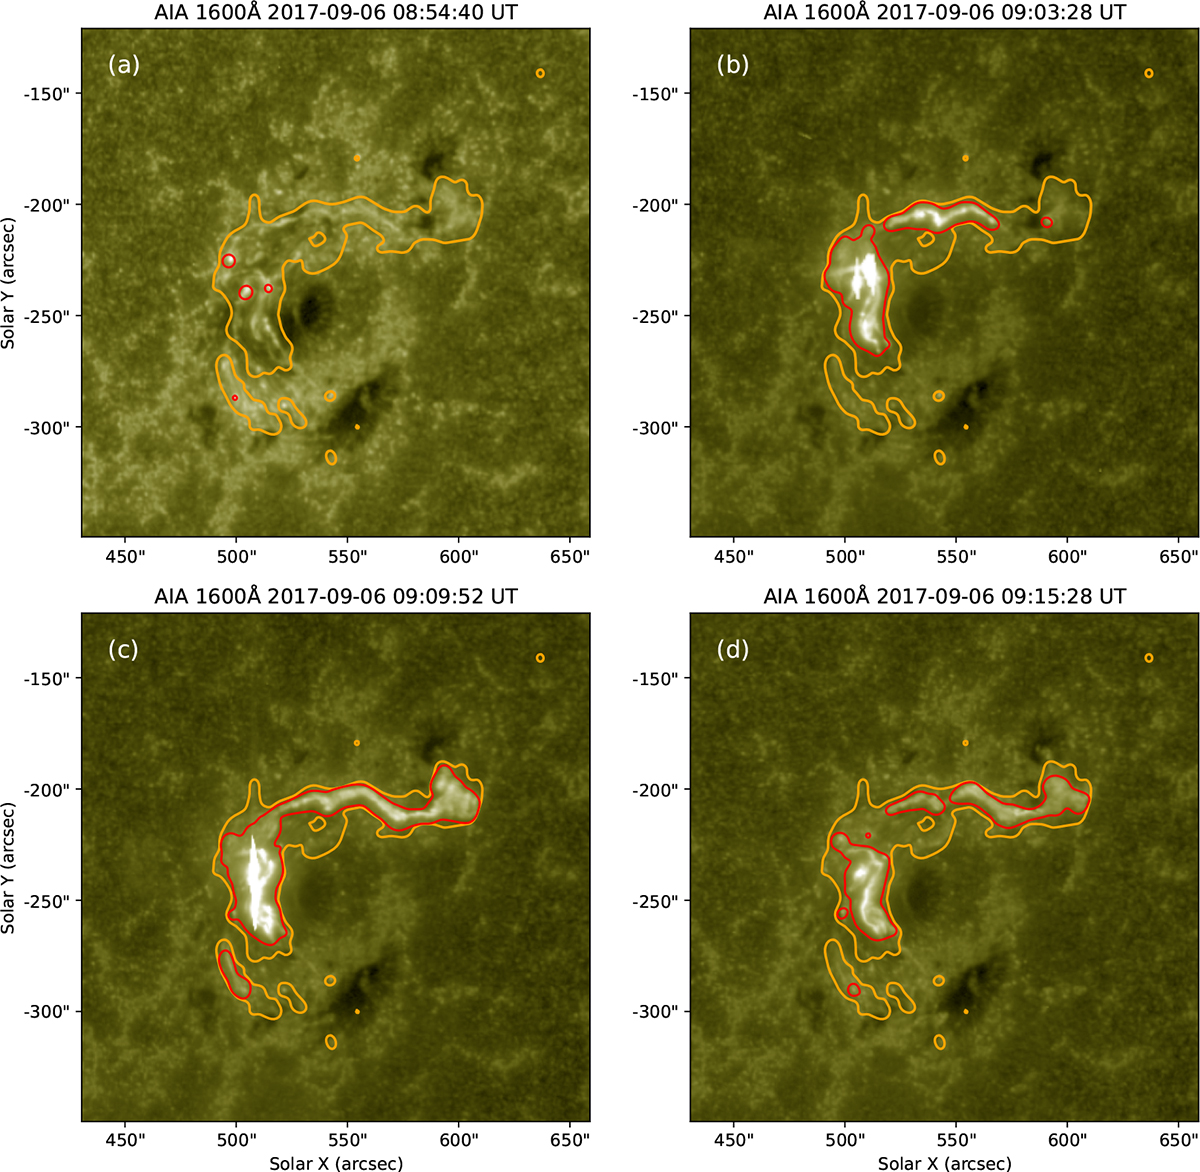
Fig. 1.
Download original image
AIA 1600 Å images showing the X2.2 flare ribbons at different times on September 6, 2017. The red contours represent the flare brightening regions identified at each time step, while the orange contours indicate the cumulative brightening region of the flare across all times. The contour level is (I1600f − I1600q) > 20σ1600q. Here I1600f and I1600q refer to the AIA 1600 Å intensities in the flare region and quiet region, respectively. σ1600q is the standard deviation of AIA 1600 Å intensities in a 100″ × 100″ quiet region.
Current usage metrics show cumulative count of Article Views (full-text article views including HTML views, PDF and ePub downloads, according to the available data) and Abstracts Views on Vision4Press platform.
Data correspond to usage on the plateform after 2015. The current usage metrics is available 48-96 hours after online publication and is updated daily on week days.
Initial download of the metrics may take a while.