Fig. 2.
Download original image
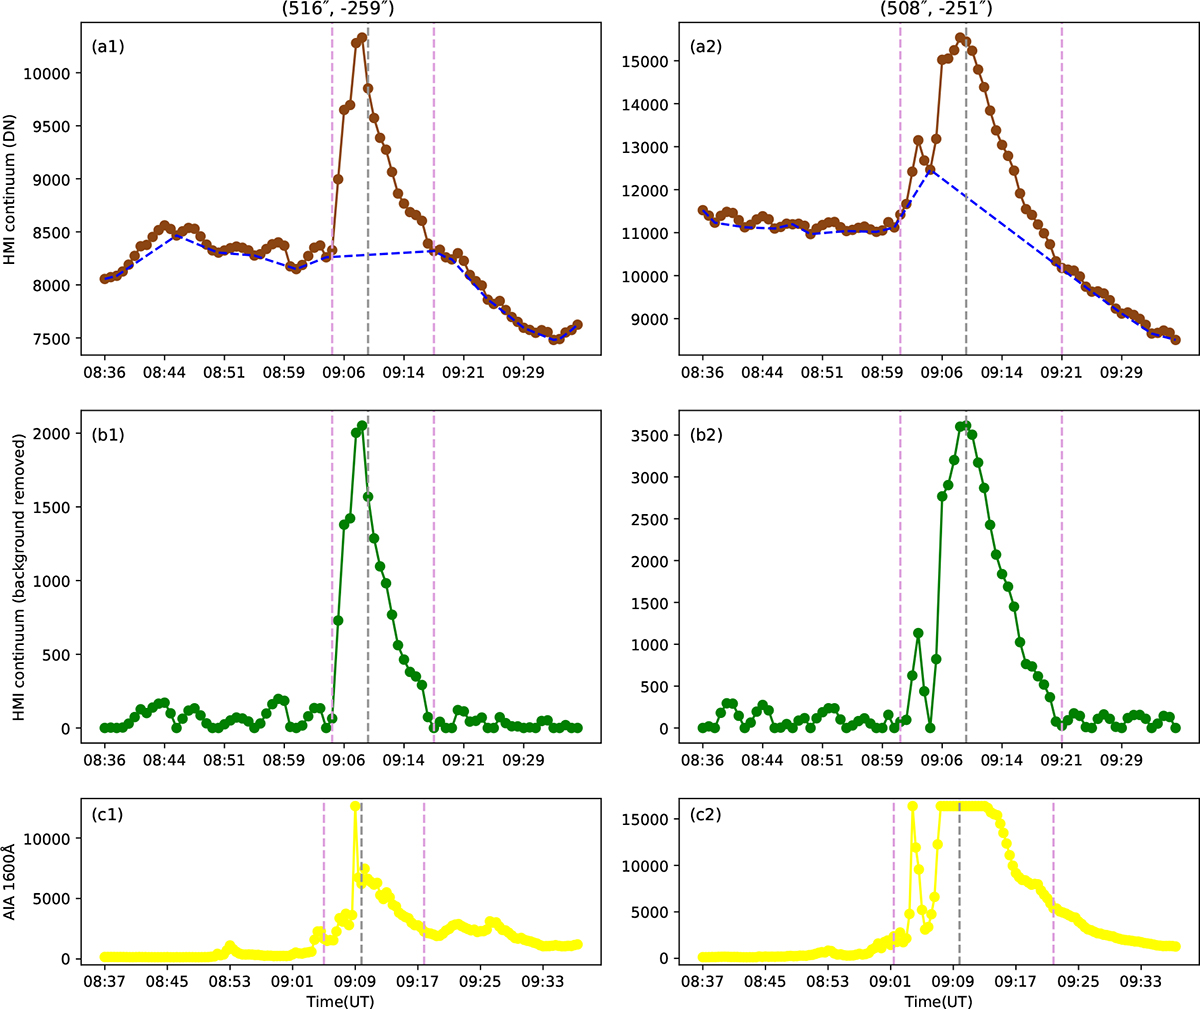
Temporal evolutions of HMI continuum and AIA 1600 Å intensities at two positions in WL enhancement regions. (a1) and (a2): HMI continuum light curves for the two WL positions, respectively. The dashed blue line indicates the background trend of the pixel. (b1) and (b2): HMI continuum light curves after removing the background, which exhibit a series of WL emission pulses. (c1) and (c2): AIA 1600 Å light curves at these two positions, respectively. The vertical grey line marks the peak time of the flare, and the vertical purple lines mark the beginning and end times of the 1600 Å impulsive emission in this pixel.
Current usage metrics show cumulative count of Article Views (full-text article views including HTML views, PDF and ePub downloads, according to the available data) and Abstracts Views on Vision4Press platform.
Data correspond to usage on the plateform after 2015. The current usage metrics is available 48-96 hours after online publication and is updated daily on week days.
Initial download of the metrics may take a while.