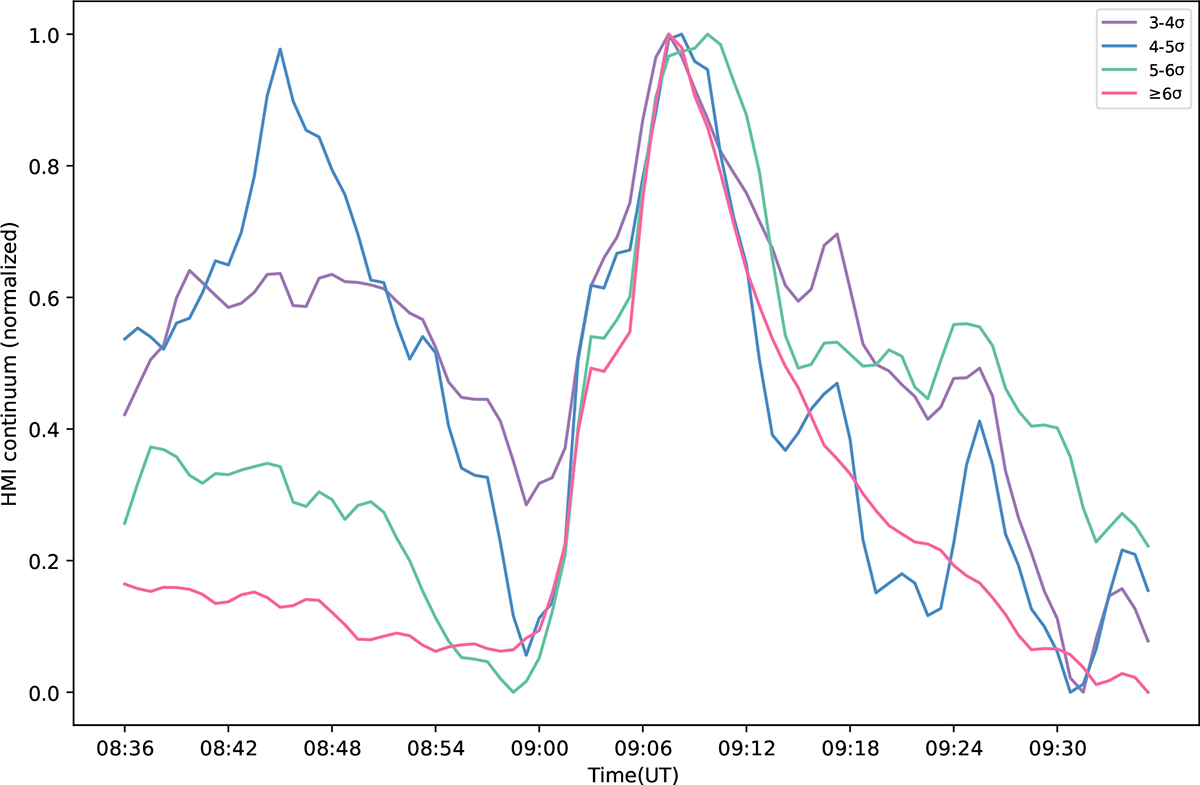
Fig. 3.
Download original image
Averages of HMI continuum light curves (normalized) within different threshold ranges. The threshold ranges are  (purple),
  (sky blue),
  (green),
  (pink). Here Ifm refers to the maximum value of all the WL emission pulses during the flare (see Figs. 2b1 and 2b2). I0i refer to the values of WL emission pulses before and after the flare (also see Figs. 2b1 and 2b2). And σ is the corresponding standard deviation for I0i.
Current usage metrics show cumulative count of Article Views (full-text article views including HTML views, PDF and ePub downloads, according to the available data) and Abstracts Views on Vision4Press platform.
Data correspond to usage on the plateform after 2015. The current usage metrics is available 48-96 hours after online publication and is updated daily on week days.
Initial download of the metrics may take a while.