Fig. 4.
Download original image
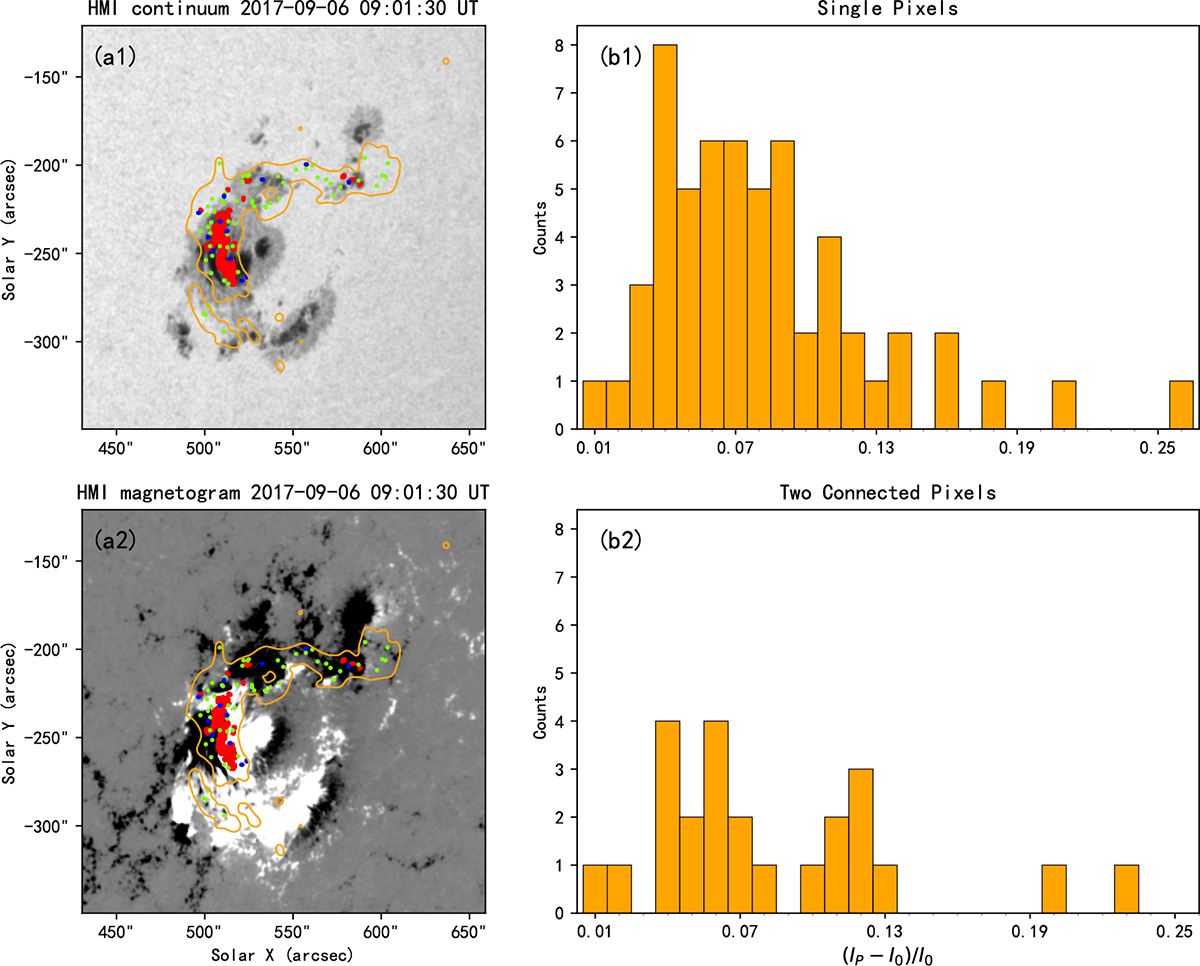
(a1) and (a2): HMI continuum image and LOS magnetogram for the active region NOAA 12673 at 09:01:30 UT on September 6, 2017. The orange contours mark the flare regions. The red region indicates the area of concentrated WL pixels. The green denotes a single isolated WL pixel, while the blue denotes only two conjoined WL pixels. (b1) and (b2): Statistical plots of the WL enhancement ((Ip − I0)/I0) for the isolated single-pixel region and the adjacent two-pixel region, respectively. Here Ip and I0 refer to the HMI continuum intensities at the peak of WL flux and before the flare at a pixel.
Current usage metrics show cumulative count of Article Views (full-text article views including HTML views, PDF and ePub downloads, according to the available data) and Abstracts Views on Vision4Press platform.
Data correspond to usage on the plateform after 2015. The current usage metrics is available 48-96 hours after online publication and is updated daily on week days.
Initial download of the metrics may take a while.