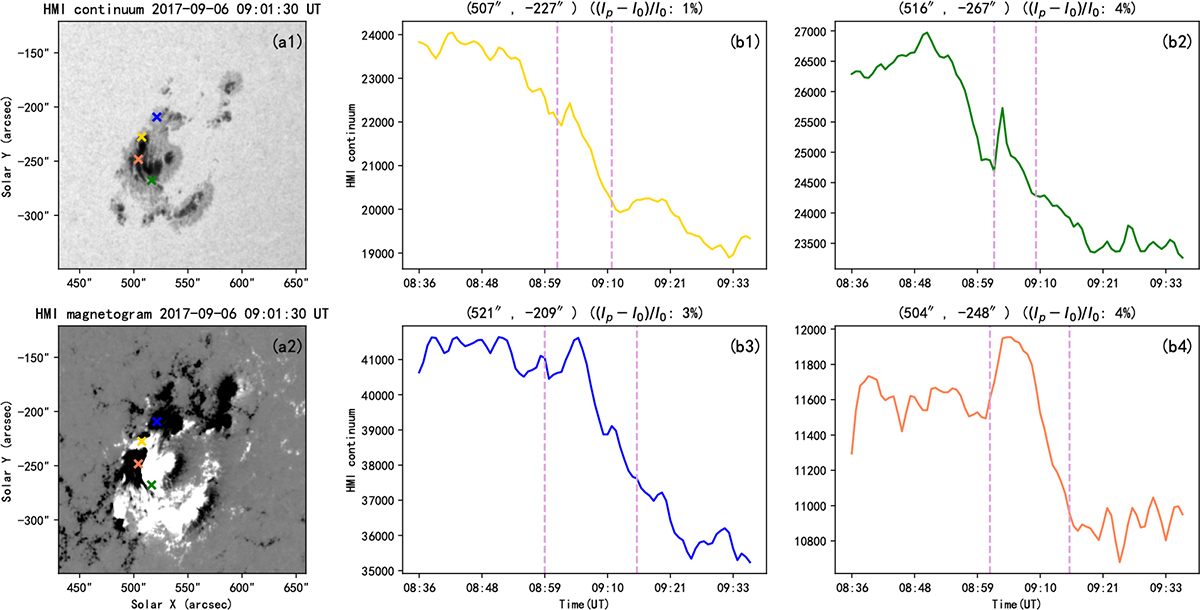
Fig. 6.
Download original image
HMI continuum light curves showing very weak WL emissions during the flare at four different positions. (a1) and (a2): HMI continuum map and LOS magnetogram of the NOAA 12673 at the time of 09:09:45 UT on September 6, 2017. The four ‘×’ symbols in different colours mark the positions where we show the HMI continuum light curves. (b1)–(b4): Corresponding HMI continuum light curves at four different positions. The vertical purple lines mark the beginning and end times of the 1600 Å impulsive emission at the position. The corresponding WL enhancements ((Ip − I0)/I0) are given at the top of these panels.
Current usage metrics show cumulative count of Article Views (full-text article views including HTML views, PDF and ePub downloads, according to the available data) and Abstracts Views on Vision4Press platform.
Data correspond to usage on the plateform after 2015. The current usage metrics is available 48-96 hours after online publication and is updated daily on week days.
Initial download of the metrics may take a while.