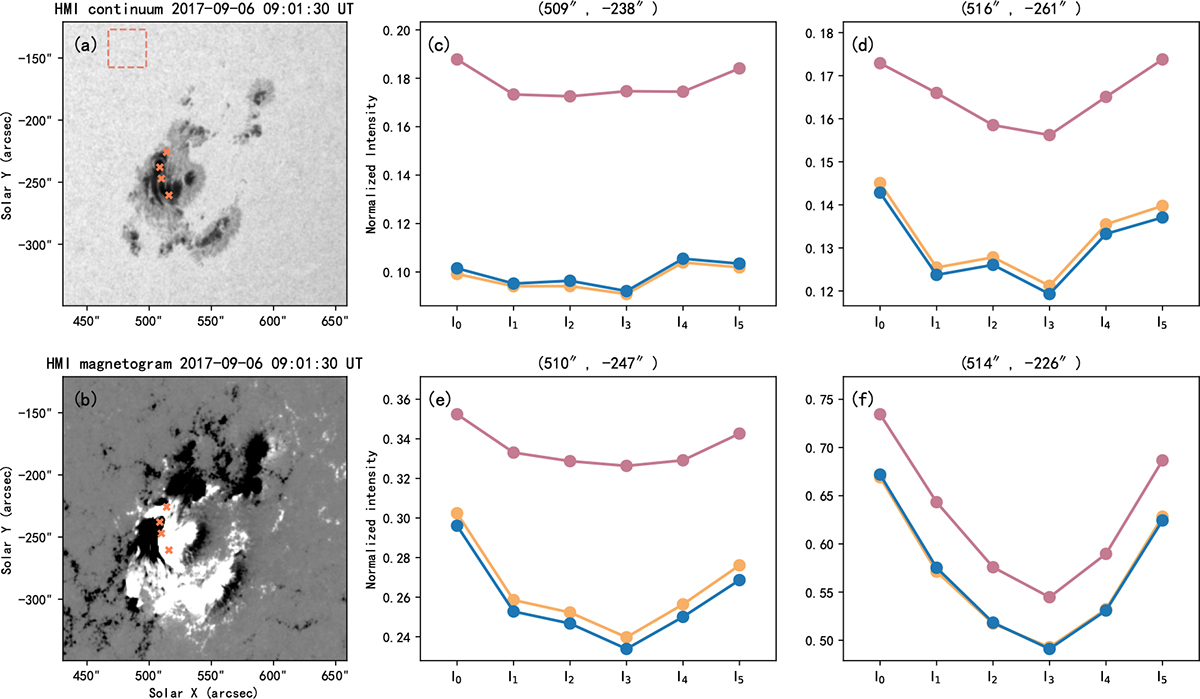
Fig. 8.
Download original image
Spectral profiles of HMI Fe I 6173 Å at four different positions. (a) and (b): HMI continuum intensity map and LOS magnetogram, respectively. The orange ‘×’ marks the four positions. (e) and (f): HMI Fe I 6173 Å spectral profiles for the four positions at three different times, i.e. 08:48 UT (yellow), 09:00 UT (blue), and 09:12 UT (purple). 08:48 UT and 09:00 UT are before the flare, while 09:12 UT is around the peak of flare. All the spectral profiles are normalized (Ii/Iq, i = 0, 1, 2, 3, 4, 5) by the average continuum intensity (Iq) in the quiet region marked by the dashed brown box in panel a.
Current usage metrics show cumulative count of Article Views (full-text article views including HTML views, PDF and ePub downloads, according to the available data) and Abstracts Views on Vision4Press platform.
Data correspond to usage on the plateform after 2015. The current usage metrics is available 48-96 hours after online publication and is updated daily on week days.
Initial download of the metrics may take a while.