Fig. 12
Download original image
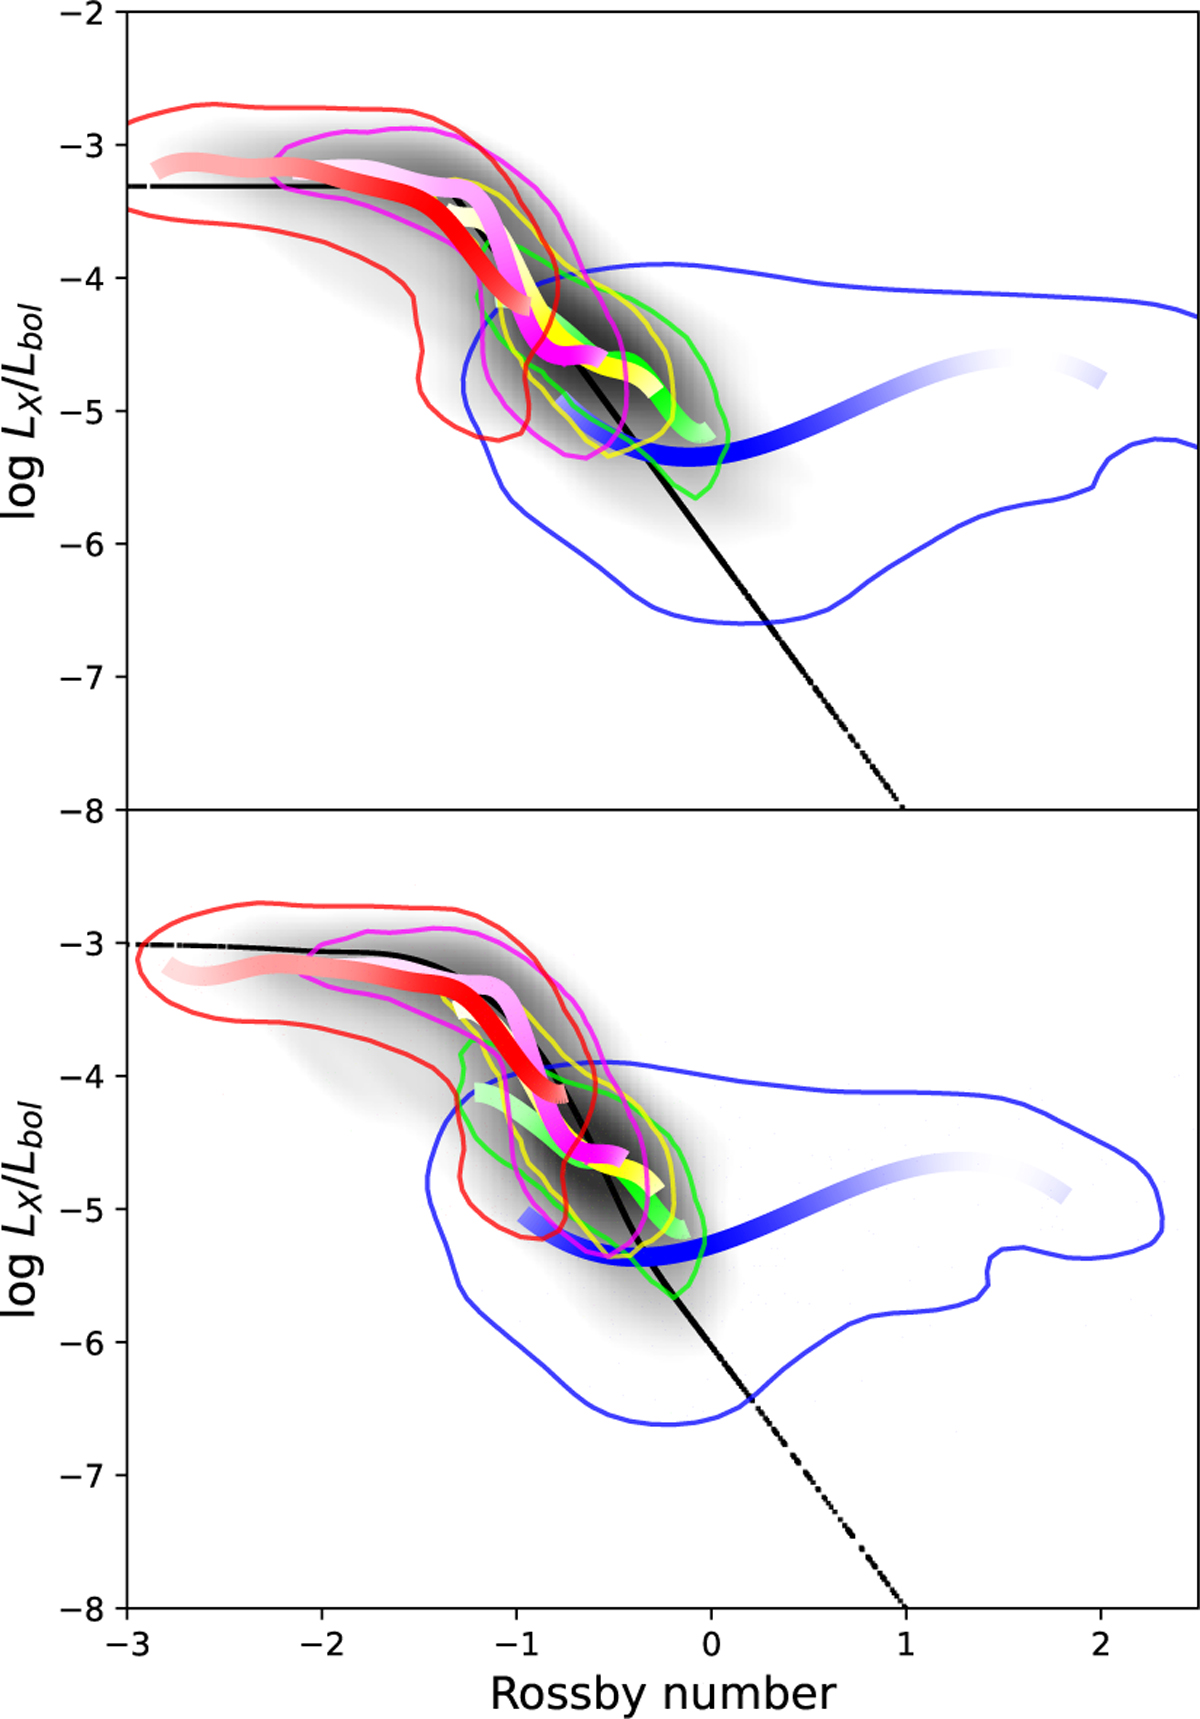
LX/Lbol ratio vs. Rossby number for our sample stars with the different colors indicating the different spectral types: blue indicating A and early F-type stars, green late F-type stars, yellow G-type stars, magenta K-type stars, and red M-type stars. Population medians (thick line) and the 90% contours (thin lines) of the population are also shown. The gray-shaded area indicates the density of the data points, the black line is the best fit with the functional form as given by Eqs. (4) (top panel) and (5) (bottom panel). See text for details.
Current usage metrics show cumulative count of Article Views (full-text article views including HTML views, PDF and ePub downloads, according to the available data) and Abstracts Views on Vision4Press platform.
Data correspond to usage on the plateform after 2015. The current usage metrics is available 48-96 hours after online publication and is updated daily on week days.
Initial download of the metrics may take a while.