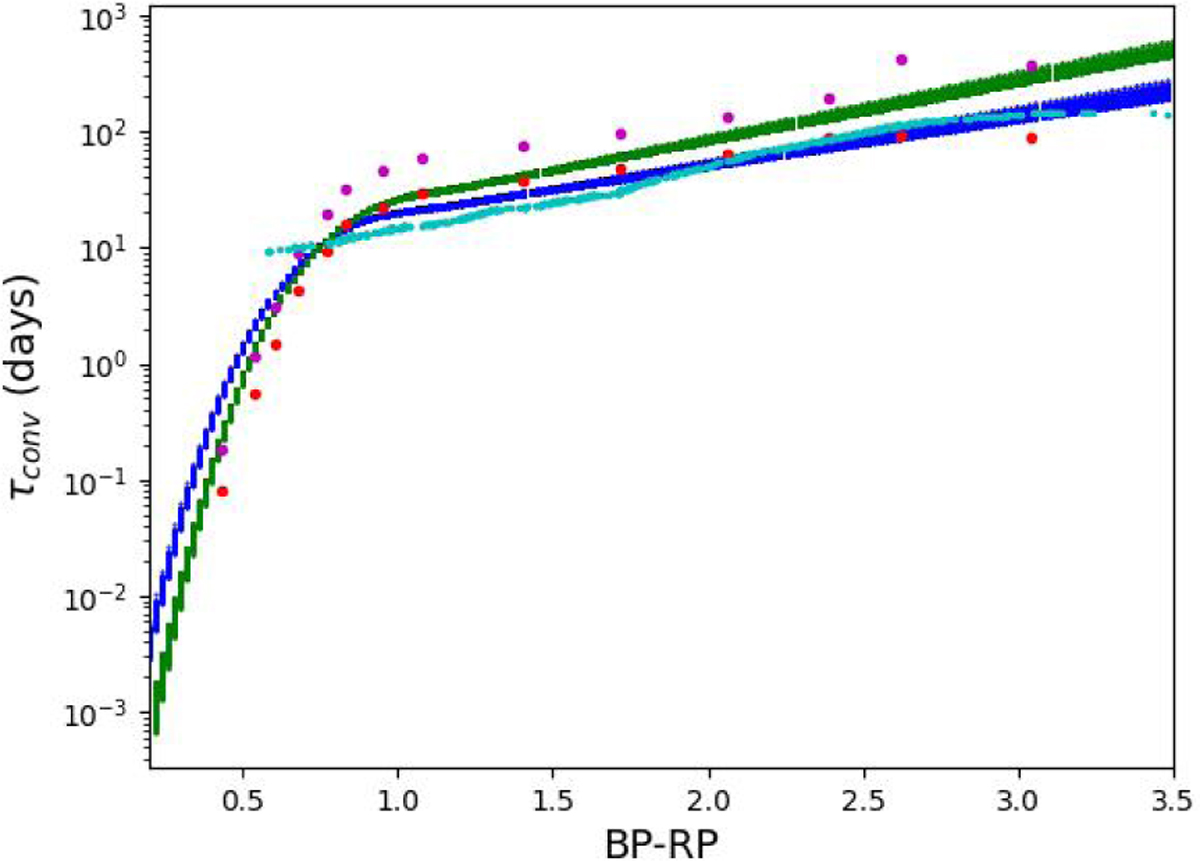
Fig. 13
Download original image
“Best-fit” convective turnover time vs. BP-RP colors (derived from Eq. (4) as blue solid curve, derived from Eq. (5) as green solid curve); the shown data points (global convective turnover time in red, local convective turnover time in magenta) come from the theoretical calculations by Landin et al. (2023), the cyan data points are derived from the sample presented by Wright et al. (2011). See text for details.
Current usage metrics show cumulative count of Article Views (full-text article views including HTML views, PDF and ePub downloads, according to the available data) and Abstracts Views on Vision4Press platform.
Data correspond to usage on the plateform after 2015. The current usage metrics is available 48-96 hours after online publication and is updated daily on week days.
Initial download of the metrics may take a while.