Fig. 14
Download original image
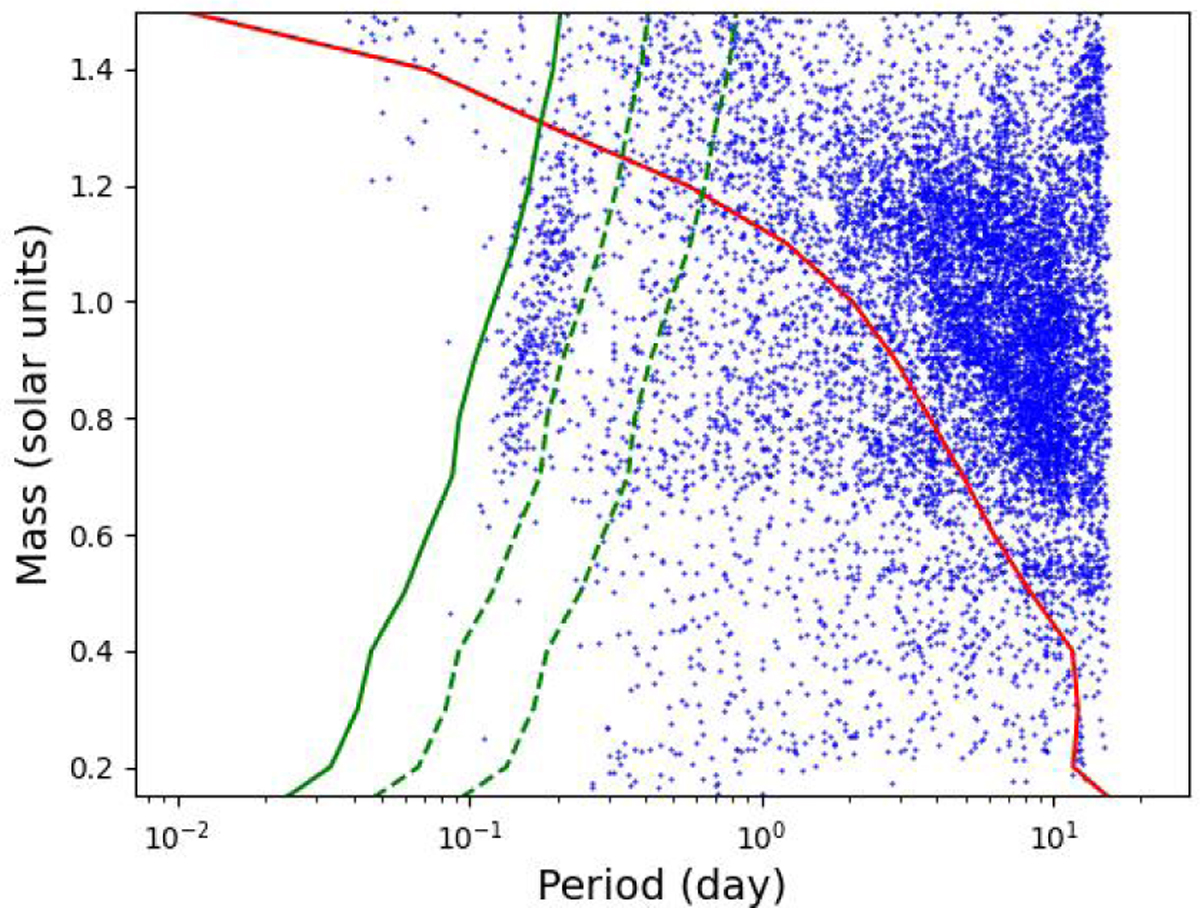
Mass (in solar units) vs. period (in days) for our MS sample, with masses estimated from the stars’ BP-RP colors using data tables from Pecaut & Mamajek (2013). The red solid line is the period computed from Eq. (4) at the Rossby break point, Robreak, and the convective turnover time computed from Eq. (3). The green lines show the break up periods computed from Eq. (1). See text for details.
Current usage metrics show cumulative count of Article Views (full-text article views including HTML views, PDF and ePub downloads, according to the available data) and Abstracts Views on Vision4Press platform.
Data correspond to usage on the plateform after 2015. The current usage metrics is available 48-96 hours after online publication and is updated daily on week days.
Initial download of the metrics may take a while.