Open Access
Fig. 6
Download original image
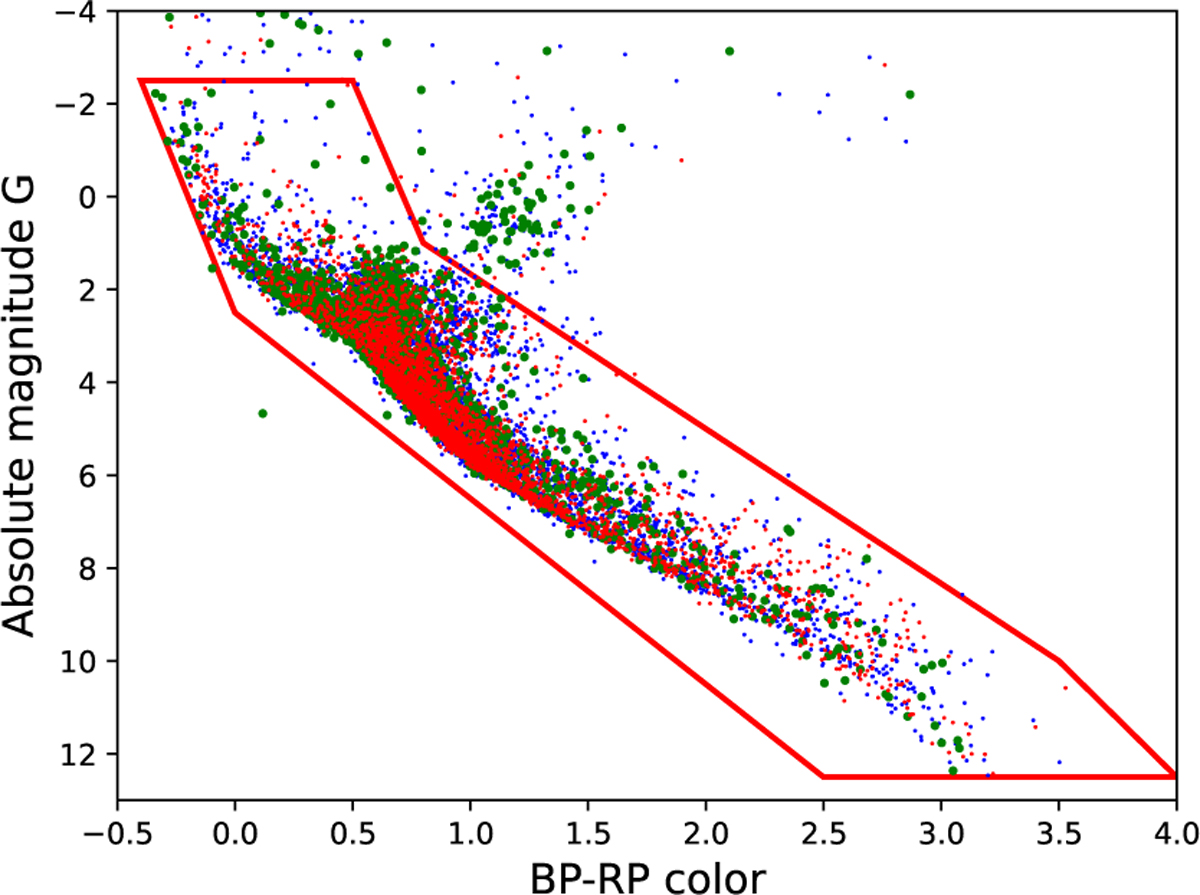
Color magnitude diagram (based on Gaia values) for eROSITA detected stars with successful TESS period measurements, with the indicated red polygonal region defining our MS sample. The data points are color coded according to period quality: green (grade 3), blue (grade 4), and red for higher grades. See text for details.
Current usage metrics show cumulative count of Article Views (full-text article views including HTML views, PDF and ePub downloads, according to the available data) and Abstracts Views on Vision4Press platform.
Data correspond to usage on the plateform after 2015. The current usage metrics is available 48-96 hours after online publication and is updated daily on week days.
Initial download of the metrics may take a while.