Fig. 7
Download original image
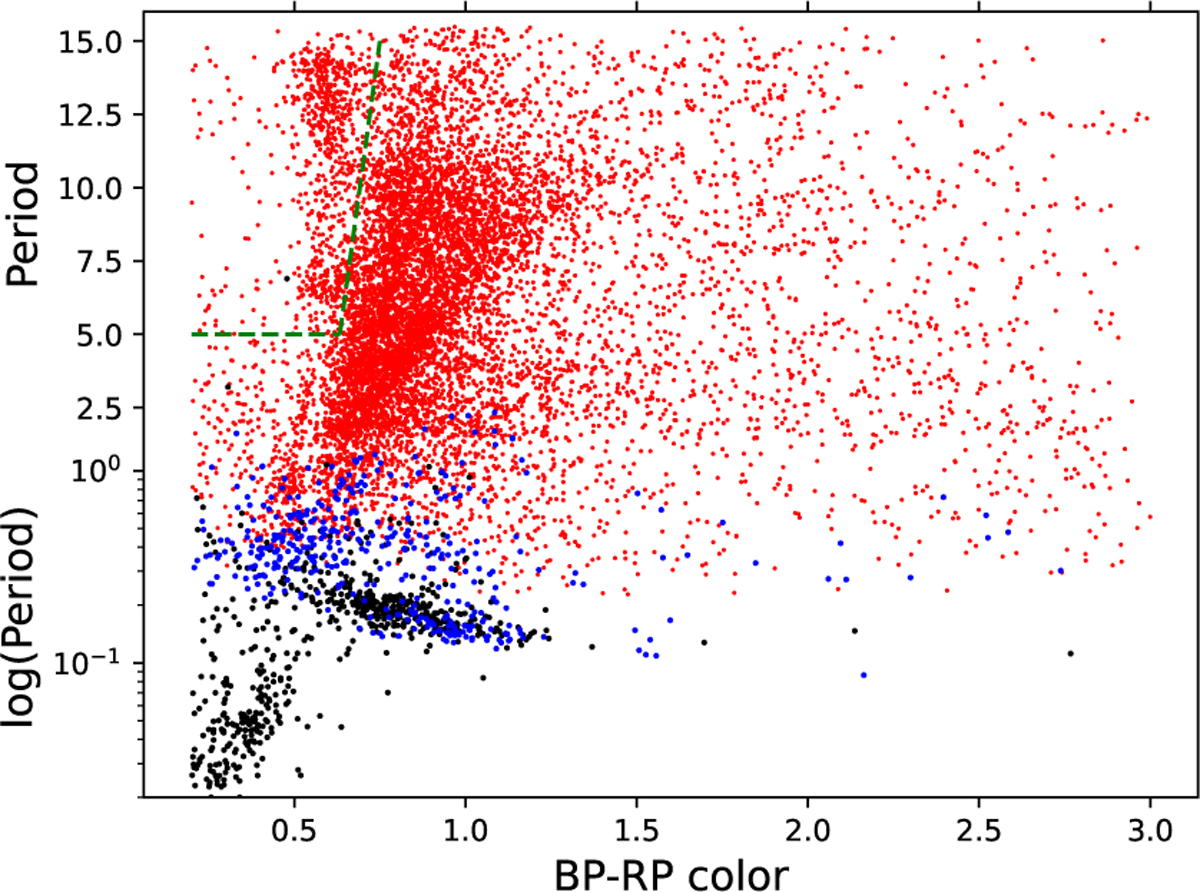
Period (in days) vs. BP-RP color for the MS sample with grade 4 and higher; black symbols refer to stars with periods in excess of the estimated break-up period, blue symbols refer to stars with more than 50% of breakup, red symbols to those below. Note: the period scale for periods below 1.5 d is logarithmic. The periods for the stars inside the green dashed lines are not thought to be rotational periods. See text for details.
Current usage metrics show cumulative count of Article Views (full-text article views including HTML views, PDF and ePub downloads, according to the available data) and Abstracts Views on Vision4Press platform.
Data correspond to usage on the plateform after 2015. The current usage metrics is available 48-96 hours after online publication and is updated daily on week days.
Initial download of the metrics may take a while.