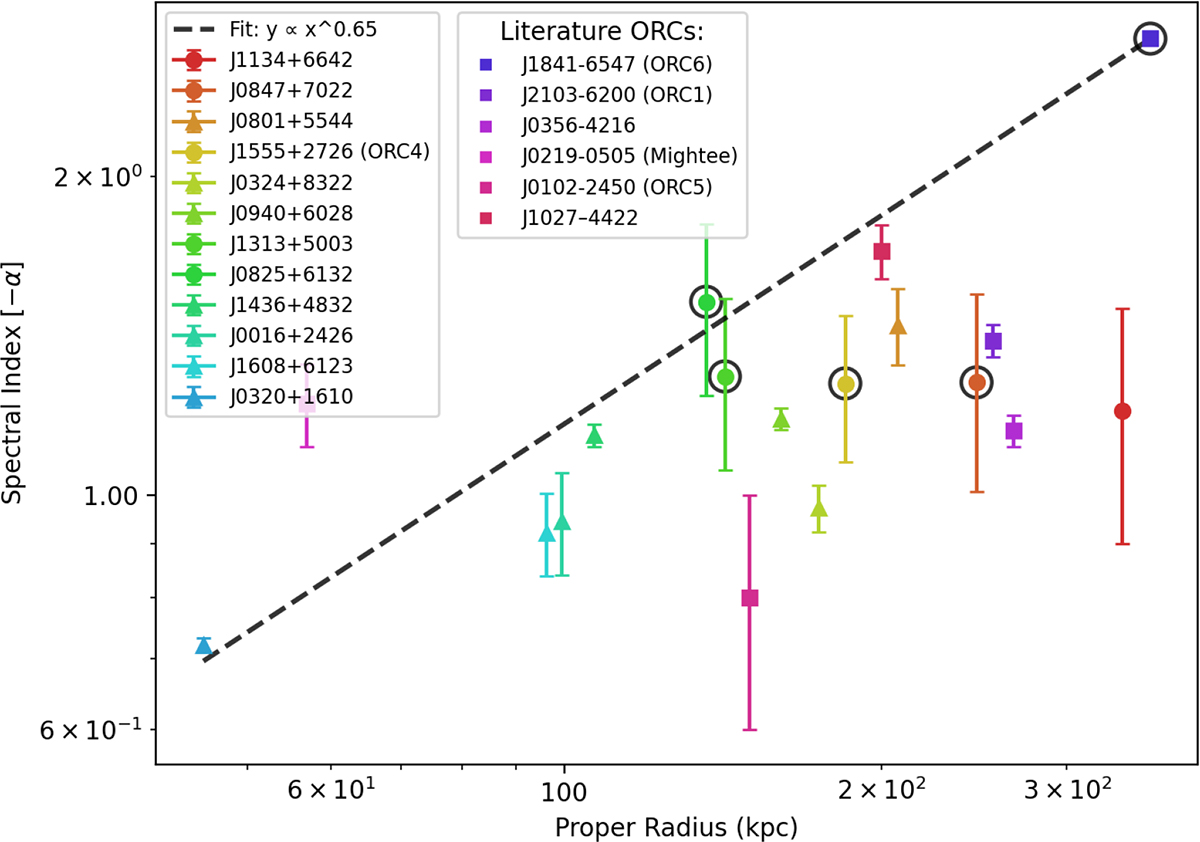
Fig. 11.
Download original image
Integrated spectral index of ORCs (circles) and candidate ORCs (triangles) in our sample plotted against the physical radius of the source. Markers within a circle are for DHORCs. The dashed line shows a log-log linear regression. We included the following sources from the literature: J1841−6547 (ORC6: Koribalski et al. 2025), J2103−6200 (ORC1; Norris et al. 2021b), J0356−4216 (Taziaux et al. 2025), 0219−0505 (Mightee; Norris et al. 2025), J0102−2450 (ORC5; Koribalski et al. 2021), and J1027−4422 (Koribalski et al. 2024b).
Current usage metrics show cumulative count of Article Views (full-text article views including HTML views, PDF and ePub downloads, according to the available data) and Abstracts Views on Vision4Press platform.
Data correspond to usage on the plateform after 2015. The current usage metrics is available 48-96 hours after online publication and is updated daily on week days.
Initial download of the metrics may take a while.